- Market Value (2025): USD 56.5 Bn
- Estimated Value (2026): USD 58.5 Bn
- Forecast Value (2036): USD 83.3 Bn
- CAGR (2026-2036): 3.6%
What is the Crude Oil Carrier Market forecast to be worth by 2036?
USD 58.5 billion in 2026 to USD 83.3 billion by 2036, at 3.6% CAGR.
- The crude oil carrier market crossed USD 56.5 billion in 2025 as long-distance cargo programs sustained fleet spending.
- Demand is projected to rise from USD 58.5 billion in 2026 to USD 83.3 billion by 2036.
- The market is forecast to record a 3.6% CAGR during the forecast driven by owners balancing transport economics with fuel-transition requirements.
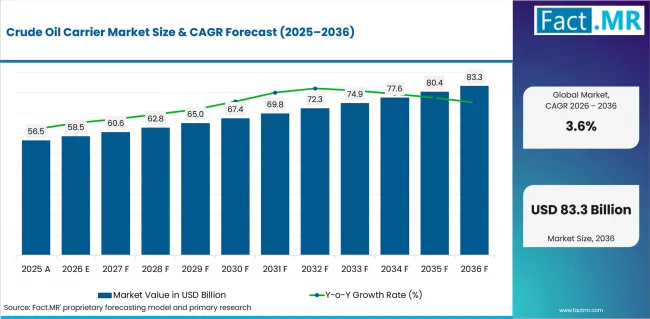
Crude Oil Carrier Market Value Analysis | Source: Fact.MR
What are the defining numbers behind Crude Oil Carrier Market growth?
USD 26.8 billion absolute opportunity by 2036, led by very large crude carriers and long-haul crude oil transportation.
- Demand Drivers in the Market
- Cargo owners need dependable long-distance capacity because export diversification increases voyage length and vessel-day requirements.
- Fleet operators replace inefficient tonnage once fuel savings and charter eligibility support investment across several trade routes.
- Shipyards secure orders after owners arrange financing and employment around a credible delivery slot for fleet renewal.
- Technical managers favor designs that preserve cargo intake while supporting class approval and later propulsion conversion.
- Key Segments Analyzed
- By vessel type: Very large crude carriers are expected to hold 39.0% share in 2026 due to deep-sea transport economics.
- By application: Long-haul crude transportation is projected to account for 46.0% share in 2026 owing to longer voyages.
- By end user: Oil and gas companies are anticipated to capture 44.0% share in 2026 through long-term cargo control.
- By distribution channel: Direct shipyard contracts are estimated to represent 52.0% share in 2026 attributable to specification control.
- By propulsion type: Conventional fuel propulsion is forecast to account for 58.0% share in 2026 driven by service availability.
- Analyst Opinion at Fact.MR
- Shambhu Nath Jha Principal Consultant at Fact.MR and states: “Crude carrier orders now depend on residual value alongside transport capacity. Owners are expected to favor efficient designs with credible conversion pathways. Shipyards must document lifecycle performance and delivery risk before technical approval.”
- Strategic Implications
- Vessel owners should test newbuild economics across freight and fuel scenarios before approving unfamiliar propulsion pathways.
- Cargo owners should align charter duration with terminal compatibility and emissions reporting during specialized vessel approval.
- Shipyards should document cargo penalties and conversion scope so fuel readiness carries a measurable residual-value benefit.
- Technical managers should secure class acceptance and service coverage for systems with unfamiliar maintenance requirements.
Fleet operators increasingly pair dual-fuel capability with efficiency controls as AET ordered two LNG dual-fuel Suezmax tankers from Samsung Heavy Industries in November 2025.
Japan and South Korea are projected at 4.7% and 4.4% CAGRs respectively as ship and boat building supports investment. The United States is anticipated at 4.1% CAGR due to steady exports. Singapore and Norway are forecast at 3.8% CAGR and 3.5% CAGR because bunker fuel supply shapes decisions.
How does the Crude Oil Carrier Market break down by segment?
Very large crude carriers are projected to account for 39.0% share while long-haul transportation is estimated at 46.0%.
Which vessel type dominates?
Very large crude carriers are projected to account for 39.0% share in 2026
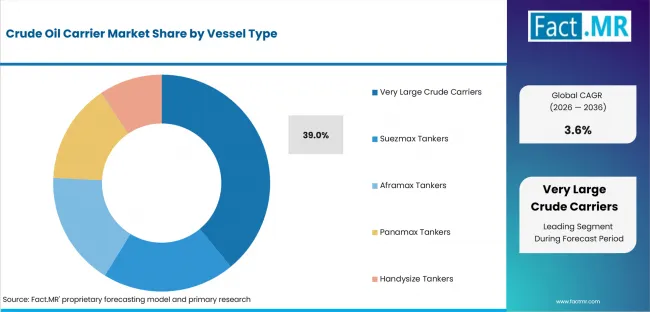
Crude Oil Carrier Market Analysis By Vessel Type | Source: Fact.MR
In 2026 very large crude carriers are expected to lead vessel type with 39.0% share because cargo scale lowers deep-sea costs. Bruton ordered LNG-ready VLCCs in October 2025 with verified ballast water treatment capability.
What leads the Application segment?
Long-haul crude oil transportation is estimated to garner 46.0% share in 2026
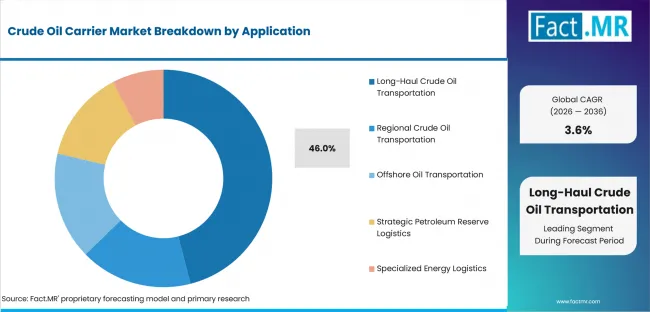
Crude Oil Carrier Market Analysis By Application | Source: Fact.MR
Based on application long-haul crude transportation is projected to account for 46.0% share in 2026 due to greater vessel-day use. Intercontinental routes strengthen demand for marine engine monitoring across repeated voyages.
How do Oil and Gas Companies shape the End User segment?
Oil and gas companies are forecast to represent 44.0% share in 2026
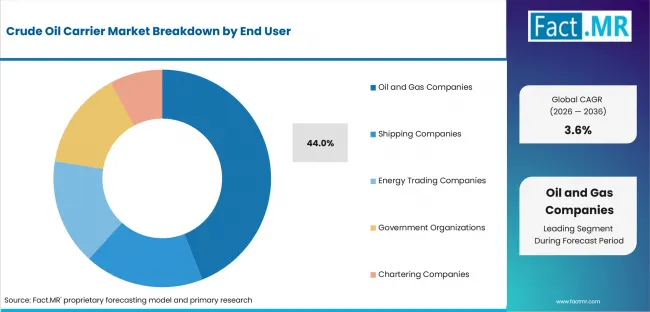
Crude Oil Carrier Market Analysis By End User | Source: Fact.MR
By end user oil and gas companies are estimated to hold 44.0% share in 2026 owing to long-term cargo control. NYK tied a methanol dual-fuel VLCC to an Idemitsu charter while connected ship platforms support oversight.
What supports Direct Shipyard Contracts within Distribution Channel?
Direct shipyard contracts are anticipated to capture 52.0% share in 2026
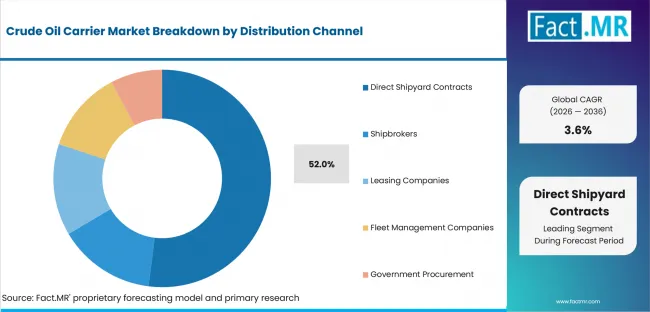
Crude Oil Carrier Market Analysis By Distribution Channel | Source: Fact.MR
Direct shipyard contracts are forecast to represent 52.0% share in 2026 due to specification control. DHT contracted Hanwha Ocean in June 2026 and assigned delivery obligations alongside automatic identification systems requirements.
What keeps Conventional Fuel Propulsion central?
Conventional fuel propulsion is expected to hold 58.0% share in 2026
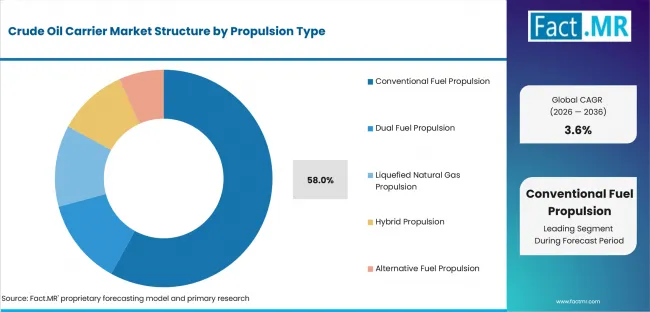
Crude Oil Carrier Market Analysis By Propulsion Type | Source: Fact.MR
Conventional fuel propulsion is projected to hold 58.0% share in 2026 owing to global fuel access and familiar maintenance. Owners treat low-carbon ammonia propulsion and marine power batteries as future or auxiliary pathways.
What is accelerating Crude Oil Carrier Market adoption, and what is holding it back?
Longer crude routes drive fleet renewal; capital exposure and unsettled fuel rules restrain ordering.
Drivers Impact Analysis
| DRIVER | (~) % IMPACT ON CAGR | GEOGRAPHIC RELEVANCE | IMPACT TIMELINE |
|---|---|---|---|
| Longer crude routes | +0.5% | Asia Pacific and North America | Medium term (2-4 years) |
| Aging tanker replacement | +0.4% | Global fleet-owning markets | Long term (>= 4 years) |
| Strategic stock logistics | +0.3% | Japan and Europe | Medium term (2-4 years) |
| Verified fuel and emissions performance | +0.3% | Europe and Asia Pacific | Medium term (2-4 years) |
| Export-terminal cargo growth | +0.2% | USA and Middle East | Long term (>= 4 years) |
Source: Fact.MR analysis. Updated Jul 31, 2026
- Route diversification: Longer intercontinental voyages increase vessel-days and reward efficient hulls across changing destination mixes and freight cycles.
- Fleet replacement: Higher fuel costs and charter scrutiny support selective orders for efficient replacement tonnage across aging fleets.
- Energy security: Import-dependent economies value dependable tanker access because diversified supply routes reduce disruption exposure during cargo changes.
- Performance verification: Charterers require auditable fuel and emissions records before approving long-term contracts for newly delivered vessels.
Opportunity Impact Analysis
| OPPORTUNITY | (~) % IMPACT ON CAGR | GEOGRAPHIC RELEVANCE | IMPACT TIMELINE |
|---|---|---|---|
| Conversion-ready fuel arrangements | +0.4% | Europe and Asia Pacific | Medium term (2-4 years) |
| Integrated efficiency systems | +0.3% | Global large-tanker fleets | Medium term (2-4 years) |
| Port-compatible Aframax designs | +0.3% | Europe and Latin America | Long term (>= 4 years) |
| Lifecycle retrofit services | +0.2% | Singapore and Norway | Long term (>= 4 years) |
Source: Fact.MR analysis. Updated Jul 31, 2026
- Conversion-ready architecture: Defined tank space and structural allowances protect later fuel conversion without sacrificing immediate cargo capacity.
- Integrated efficiency systems: Hull devices and voyage monitoring create measurable savings that technical managers verify during operation.
- Port-compatible Aframax designs: Draft-limited terminals favor medium-size tankers that preserve cargo access and operating efficiency across regional routes.
Restraints Impact Analysis
| RESTRAINT | (~) % IMPACT ON CAGR | GEOGRAPHIC RELEVANCE | IMPACT TIMELINE |
|---|---|---|---|
| Capital and financing exposure | -0.5% | Global shipowning markets | Medium term (2-4 years) |
| Future-fuel uncertainty | -0.4% | Europe and Asia Pacific | Medium term (2-4 years) |
| Shipyard capacity constraints | -0.3% | South Korea and China | Short term (<= 2 years) |
| Draft and terminal limits | -0.2% | Regional and constrained ports | Long term (>= 4 years) |
Source: Fact.MR analysis. Updated Jul 31, 2026
- Capital exposure: Early financing slows orders unless charter support protects construction and initial operating cash flow.
- Fuel-policy uncertainty: Owners lack uniform fuel infrastructure and stable long-term economics across major international trading routes today. The IMO continued Net-Zero Framework work in May 2026 which favors several propulsion pathways.
- Delivery execution risk: Dock constraints and equipment delays weaken schedule confidence and raise approval thresholds across tanker programs.
Which countries are scaling Crude Oil Carrier Market fastest?
Japan 4.7%; South Korea 4.4%; United States 4.1%; Singapore 3.8%; Norway 3.5%.
The crude oil carrier market is segmented into North America, Europe, Asia Pacific, Central and South America, and the Middle East and Africa.
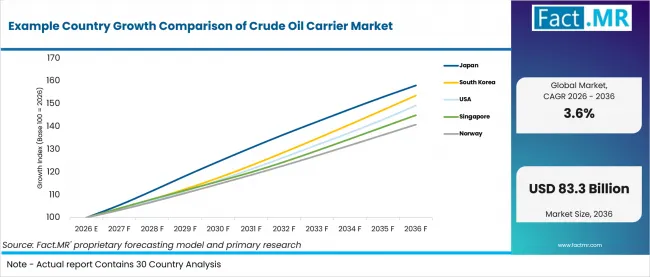
Example Country Growth Comparison Of Crude Oil Carrier Market | Source: Fact.MR
| COUNTRY | CAGR |
|---|---|
| Japan | 4.7% |
| South Korea | 4.4% |
| United States | 4.1% |
| Singapore | 3.8% |
| Norway | 3.5% |
Source: Fact.MR analysis. Updated Jul 31, 2026
What is driving Japan's growth through 2036?
4.7% CAGR, supported by import security and long-haul crude logistics.
Japan depends on imported crude and terminal-compatible tankers for long Middle East routes. JOGMEC renewed Okinawa storage arrangements in November 2025 which supports a projected 4.7% CAGR despite fuel uncertainty around marine genset systems.
How is South Korea scaling Crude Oil Carrier demand?
4.4% CAGR, driven by large-yard capacity and tanker engineering depth.
South Korea combines large drydocks with integrated tanker engineering. Market in South Korea is projected at a 4.4% CAGR through 2036 while OECD data identifies falling shipbuilding employment as a schedule risk.
What supports the United States outlook?
4.1% CAGR, owing to export routes and terminal-linked vessel demand.
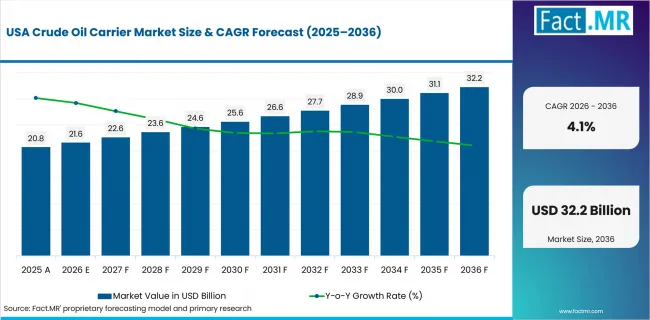
Crude Oil Carrier Market Country Value Analysis | Source: Fact.MR
United States crude exports require tonnage matching terminal draft and destination economics. Demand is anticipated at a 4.1% CAGR as exports averaged 4.0 million barrels daily in 2025 while domestic construction remains limited.
What underpins Singapore’s growth?
3.8% CAGR, shaped by registry services and multi-fuel bunkering readiness.
Singapore combines registry services with a major marine-fuel ecosystem. The market is estimated at a 3.8% CAGR in Singapore after fuel sales reached 56.77 million tonnes in 2025 while route-wide availability remains uneven.
How is Norway developing Crude Oil Carrier demand?
3.5% CAGR, supported by technical management and globally deployed shipowners.
Norwegian owners assess tanker commitments through capital discipline. Frontline added nine ECO VLCC newbuildings in May 2026 which supports a forecast 3.5% CAGR despite freight-cycle exposure around marine scrubber systems.
Who leads the Crude Oil Carrier Market?
China State Shipbuilding Corporation and HD Hyundai Heavy Industries lead large-tanker coverage, while Hanwha Ocean and Samsung Heavy Industries strengthen fuel-ready engineering.
Crude carrier construction remains concentrated among Asian shipyards with deep drydocks and proven engineering. Entry requires class-approved designs and dependable equipment networks. Owners compare delivery certainty with cargo intake before yard selection.
China State Shipbuilding Corporation and HD Hyundai Heavy Industries compete through series capacity. Other profiled yards emphasize VLCC experience and conversion-ready delivery.
Which companies are the key providers?
China State Shipbuilding Corporation and HD Hyundai Heavy Industries are key providers. Five additional profiled builders complete the company set.
Bibliography
- AET. (2025, November 7). AET signs agreements with Samsung Heavy Industries for two LNG dual-fuel Suezmax tankers.
- Bruton Limited. (2025, October 24). Bruton Limited (BRUT) – Final contracts for additional firm and optional VLCC newbuildings.
- DHT Holdings, Inc. (2026, June 3). DHT Holdings, Inc. Announces VLCC Newbuilding with Hanwha Ocean for delivery in August 2028.
- Frontline plc. (2026, May 22). FRO – First Quarter 2026 Results.
- International Maritime Organization. (2026, May 1). IMO progresses work on ship emissions, pollution and ocean protection.
- Japan Organization for Metals and Energy Security. (2025, November 19). JOGMEC and Aramco renew crude oil storage, throughput, and tank lease agreement in Okinawa.
- Maritime and Port Authority of Singapore. (2026, January 13). Singapore Posts Record Port Performance in 2025 and Develops Future Readiness through Industry Collaborations for 2026.
- Nippon Yusen Kabushiki Kaisha. (2025, April 7). NYK Concludes Contract for Construction and Charter of Dual-fuel Methanol VLCC for Idemitsu Tanker.
- Organisation for Economic Co-operation and Development. (2026, April 8). Peer Review of the Korean Shipbuilding Industry 2026.
- U.S. Energy Information Administration. (2026, March 10). Annual U.S. crude oil exports decrease for first time since 2021.
This Report Addresses
- The report covers crude carriers across vessel classes and propulsion choices shaping long-lived fleet investment decisions.
- Segment analysis covers very large crude carriers and long-haul transportation as the primary 2026 categories.
- Regional analysis compares Japan and South Korea with the United States plus Singapore and Norway.
- Competitive analysis profiles key large-tanker builders across Chinese and South Korean production networks.
- Application assessment covers long-haul and regional transport with offshore and strategic petroleum reserve movements.
- Commercial assessment explains how financing and terminal compatibility shape fuel and charter approval decisions.
What does the Crude Oil Carrier Market cover?
Purpose-built VLCC, Suezmax, Aframax, Panamax, and Handysize vessels used to transport crude oil across marine routes.
Coverage includes purpose-built tankers that transport unrefined petroleum between production areas and storage or refining locations worldwide.
Crude cargo systems and tanker safety requirements separate these vessels from general commercial shipbuilding and refined-product transportation.
What is included in the scope?
Newbuild crude carriers and specialized tanker configurations used across commercial, strategic, offshore, and government logistics programs.
Included vessels cover VLCC and Suezmax classes alongside Aframax and smaller crude tankers. The analysis evaluates commercial and strategic transport with direct contracting and alternative-fuel configurations.
What is excluded from the scope?
Product tankers, chemical tankers, LNG carriers, offshore production units, and crude oil commodities are outside the scope.
Product and chemical tankers remain excluded because their cargo systems follow different economics. LNG carriers and offshore production units also remain outside the defined vessel boundary.
How was the analysis built?
The analysis draws on 120+ sources, 35+ company portfolios, 25+ countries, and more than 20 industry interviews.
- Primary Research: Primary research includes discussions with manufacturers, service providers, technology developers, distributors, end users, procurement teams, and subject-matter experts. These conversations examine purchasing priorities, product adoption, operational challenges, approval requirements, competitive positioning, and the factors that influence wider market acceptance.
- Desk Research: Desk research covers government statistics, regulatory publications, company filings, trade data, technical studies, industry associations, standards, public policy, and other authoritative sources. Every source used in the analysis is documented in the bibliography.
- Market Sizing and Forecasting: Market estimates combine historical performance, demand indicators, pricing and volume trends, segment shares, company participation, country-level growth, adoption patterns, investment activity, and barriers to market expansion.
- Data Validation and Update Cycle: Findings are validated by comparing primary interviews with public data, company activity, regulatory changes, trade patterns, and industry developments. Regular updates review new product launches, capacity changes, partnerships, approvals, procurement trends, and shifts in commercial adoption.
Segmentation
What is the report’s scope and coverage?
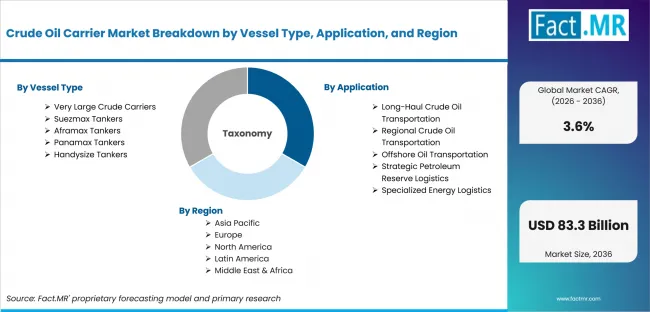
Crude Oil Carrier Market Breakdown By Vessel Type, Application, And Region | Source: Fact.MR
| Coverage field | Report scope |
|---|---|
| Quantitative Units | USD Billion |
| Market Definition | Purpose-built crude tankers used for deep-sea and regional transport. |
| Vessel Type | Very Large Crude Carriers, Suezmax Crude Carriers, Aframax Crude Carriers, Panamax Crude Carriers, Handysize Crude Carriers |
| Application | Long-Haul Crude Oil Transportation, Regional Crude Oil Transportation, Offshore Oil Transportation, Strategic Petroleum Reserve Logistics, Specialized Energy Logistics |
| End User | Oil and Gas Companies, Shipping Companies, Energy Trading Companies, Government Organizations, Chartering Companies |
| Distribution Channel | Direct Shipyard Contracts, Shipbrokers, Leasing Companies, Fleet Management Companies, Government Procurement |
| Propulsion Type | Conventional Fuel Propulsion, Dual Fuel Propulsion, Liquefied Natural Gas Propulsion, Hybrid Propulsion, Alternative Fuel Propulsion |
| Regions Covered | North America, Europe, Asia Pacific, Central and South America, Middle East and Africa |
| Countries Covered | Japan, South Korea, United States, Singapore, Norway |
| Key Companies Profiled | China State Shipbuilding Corporation, HD Hyundai Heavy Industries, Hanwha Ocean, Samsung Heavy Industries, New Times Shipbuilding, Nantong COSCO KHI Ship Engineering, Japan Marine United |
| Forecast Period | 2026 to 2036 |
| Approach | Top-down and bottom-up modelling using vessel orders, fleet age, routes, propulsion choices, and country growth. |
Source: Fact.MR analysis. Updated Jul 31, 2026
How is the market segmented?
-
By Vessel Type:
- Very Large Crude Carriers (VLCCs)
- Standard VLCCs
- Low-Emission VLCCs
- Suezmax Crude Carriers
- Conventional Suezmax
- Ice-Class Suezmax
- Aframax Crude Carriers
- Standard Aframax
- LR2 Aframax
- Panamax Crude Carriers
- Standard Panamax
- Shallow Draft Panamax
- Handysize Crude Carriers
- MR Crude Tankers
- Small Crude Tankers
- Very Large Crude Carriers (VLCCs)
-
By Application:
- Long-Haul Crude Oil Transportation
- Intercontinental Trade
- Deep Sea Shipping
- Regional Crude Oil Transportation
- Coastal Shipping
- Intra-Regional Trade
- Offshore Oil Transportation
- Floating Production Support
- Offshore Terminal Transport
- Strategic Petroleum Reserve Logistics
- Government Oil Storage
- Emergency Oil Supply
- Specialized Energy Logistics
- Arctic Shipping
- High Sulfur Crude Transport
- Long-Haul Crude Oil Transportation
-
By End User:
- Oil and Gas Companies
- Integrated Oil Companies
- National Oil Companies
- Shipping Companies
- Crude Oil Tanker Operators
- Marine Logistics Companies
- Energy Trading Companies
- Commodity Trading Firms
- Oil Marketing Companies
- Government Organizations
- Strategic Petroleum Agencies
- State-Owned Energy Companies
- Chartering Companies
- Time Charter Operators
- Voyage Charter Operators
- Oil and Gas Companies
-
By Distribution Channel:
- Direct Shipyard Contracts
- Newbuild Contracts
- Custom Vessel Orders
- Shipbrokers
- Newbuilding Brokers
- Sale and Purchase Brokers
- Leasing Companies
- Bareboat Leasing
- Finance Leasing
- Fleet Management Companies
- Technical Management Firms
- Commercial Management Firms
- Government Procurement
- Public Sector Tenders
- Defense and Strategic Procurement
- Direct Shipyard Contracts
-
By Propulsion Type:
- Conventional Fuel Propulsion
- Two Stroke Diesel Engines
- Low Speed Marine Engines
- Dual Fuel Propulsion
- LNG Dual Fuel Engines
- Methanol Ready Engines
- Liquefied Natural Gas (LNG) Propulsion
- Pure LNG Engines
- LNG Ready Systems
- Hybrid Propulsion
- Battery Hybrid Systems
- Diesel Electric Hybrid Systems
- Alternative Fuel Propulsion
- Ammonia Ready Engines
- Hydrogen Ready Engines
- Conventional Fuel Propulsion
-
By Region:
- North America
- United States
- Canada
- Europe
- Germany
- France
- United Kingdom
- Italy
- Spain
- Benelux
- Nordics
- Poland
- Czech Republic
- Romania
- Hungary
- Asia Pacific
- China
- Japan
- South Korea
- India
- ASEAN
- Australia and New Zealand
- Central and South America
- Brazil
- Mexico
- Argentina
- Chile
- Middle East and Africa
- GCC Countries
- South Africa
- Türkiye
- Israel
- North America
Frequently Asked Questions
What share are very large crude carriers expected to hold?
How is long-haul crude oil transportation positioned in 2026?
What supports oil and gas companies within end-user demand?
How much share are direct shipyard contracts estimated to represent?
Which propulsion type is projected to account for the primary share?
What supports Japan’s projected crude carrier expansion?
What is the primary driver in the crude oil carrier market?
What is the main restraint in the crude oil carrier market?
Who worked on this report


Preview the report firsthand - request a free sample
Free SampleGet the brochure for pricing and purchase details
Download PDF