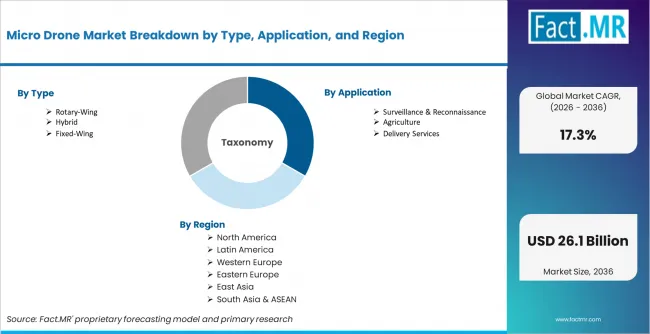
Micro Drone Market Size, Share, Growth and Forecast (2026 - 2036)
The Micro Drone Market is segmented by Type, Application, End-use, Range, Sales Channel, and Region. Forecast for 2026 to 2036.
Fact.MR states that micro drone demand moving toward compact aerial systems for close-range inspection and tactical surveillance. Defense users and industrial operators need lightweight platforms that can capture site-level data in confined areas without relying on larger UAV fleets.
Micro Drone Market Size, Market Forecast and Outlook by Fact.MR
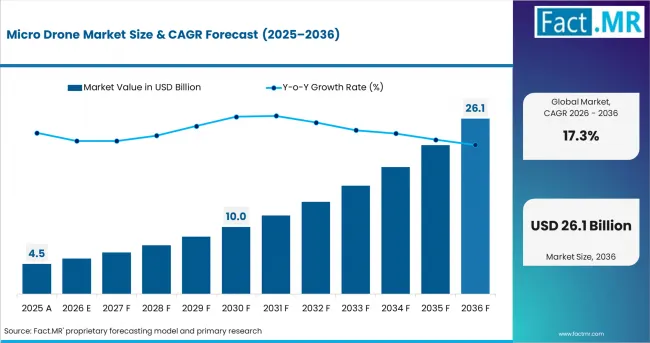
The micro drone market was valued at USD 4.5 billion in 2025. Demand is estimated to reach USD 5.3 billion in 2026. The market is projected to reach 17.3% CAGR from 2026 to 2036. Defense surveillance and creator-focused aerial imaging are forecast to lift the market to USD 26.1 billion by 2036 as drone operators shift toward smaller aircraft with faster launch cycles.
| Metric | Details |
|---|---|
| Industry Size (2026) | USD 5.3 billion |
| Industry Value (2036) | USD 26.1 billion |
| CAGR (2026 to 2036) | 17.3% |
Summary of the Micro Drone Market
- Market Definition
- The micro drone market covers compact UAVs used for short-range imaging and field monitoring. It serves defense units and inspection contractors, with demand tied to fast launch and safer visual review. Consumer creators use micro drones for portable aerial content.
- Demand Drivers in the Market
- Public Safety Review: Public safety UAV coordinators need micro drones for fast scene assessment. Compact aircraft help reduce manual review during emergency response.
- Defense Surveillance: Defense planners use micro drones for short tactical observation. Small aircraft support field intelligence without larger launch systems.
- Industrial Inspection: Inspection service providers use micro drones for roofs and confined structures. The aircraft reduce manual access needs and improve review speed.
- Key Segments Analyzed
- By Type: Rotary-wing micro drones account for 70.0% share of demand by type in the Fact.MR base as operators need vertical takeoff and stable hovering.
- By Application: Surveillance & reconnaissance represents 35.0% share of demand by application in the Fact.MR base as defense and public safety users need fast aerial review.
- By End-use: Consumer use is projected to account for 38.0% share of demand by end-use in 2026 as creators and recreational flyers need compact camera drones with simple controls.
- By Range: Short-range micro drones are expected to represent 61.0% share of demand by range in 2026 as most missions happen near the pilot and need quick flight cycles.
- By Sales Channel: Online sales are projected to account for 44.0% share of demand by sales channel in 2026 as consumer drone users compare camera quality and battery features before ordering.
- By Geography: India micro drone demand is forecast to grow at 20.1% CAGR from 2026 to 2036 as local manufacturing and defense surveillance needs expand.
- Analyst Opinion at Fact.MR
- Shambhu Nath Jha, Senior Analyst at Fact.MR, notes, “Micro drone demand is moving beyond casual flying. Defense units need compact observation tools. Public safety coordinators need aircraft that launch quickly and return usable images. Producers that improve flight safety, repair access, and battery consistency can protect repeat demand.”
- Strategic Implications
- Flight Safety: Micro drone producers must align compact design with safer control systems. Stable flight supports defense and public safety use.
- Service Access: Inspection contractors should assess suppliers through repair support and battery availability. Poor service access can reduce mission readiness.
- Channel Quality: Drone retailers need better comparison support for camera quality and flight time. Clear product guidance helps reduce returns.
- Methodology
- Fact.MR interviews drone program managers and public safety UAV coordinators for demand validation.
- Research incorporates drone rule references, product catalogues, and application-level checks.
- Market estimates are developed using type mix, application demand, and regional adoption patterns.
- Forecast assumptions are validated through supplier checks and channel feedback.
Micro drone use is supported by compact design and lower field preparation needs. Fact.MR identifies defense, agriculture, surveillance, and commercial photography as major use cases for micro drones. Small aircraft help inspection contractors and public safety coordinators collect visual data without larger UAV platforms. This supports wider use across field review and short-range monitoring. [1]
Drone operators are moving from recreational flying into repeat-use workflows. Public safety coordinators need fast scene review. Inspection contractors need small UAVs for roofs and confined locations. Defense planners need tactical aircraft that reduce personnel exposure. Supplier service is important because battery life, and safe flight controls affect repeat use.
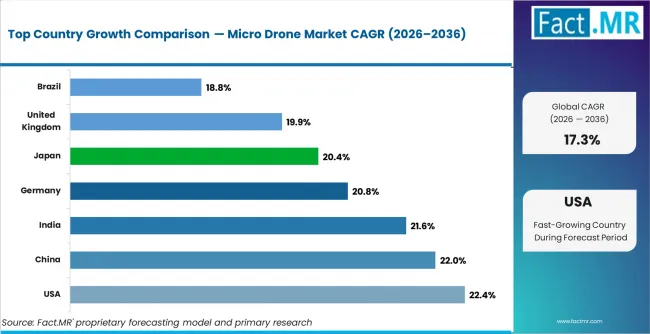
United States target drone demand is forecast to grow at 22.4% CAGR from 2026 to 2036 as Navy and Air Force training programs require advanced aerial targets. China is anticipated to record 22.0% CAGR as air defense modernization supports target simulation demand. India is forecast to post 21.6% CAGR as indigenous defense testing and drone warfare readiness lift adoption. Germany is projected to grow at 20.8% CAGR through NATO training and missile defense readiness. Japan may register 20.4% CAGR as maritime air defense training needs realistic target systems. United Kingdom demand is likely to rise at 19.9% CAGR as military training programs require more advanced aerial threat replication. Brazil records 18.8% CAGR through air force training and defense modernization.
Segmental Analysis
Micro Drone Market Analysis by Type
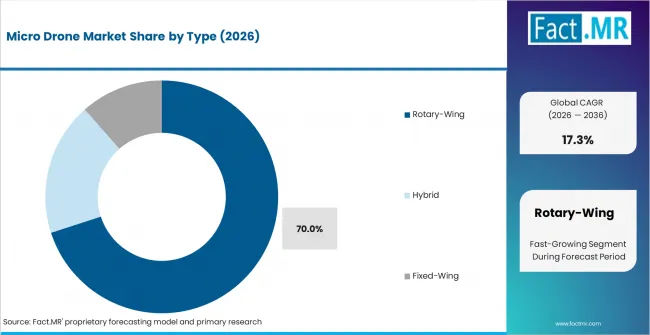
Rotary-wing micro drones lead because they can hover and take off vertically in tight spaces. The rotary-wing drones are expected to reach 70.0% share by type as field operators need stable image capture during short missions. Fixed-wing drones serve wider area review but need more launch space. Hybrid drones gain attention in higher-specification use because they combine lift flexibility with better coverage. DJI, Skydio, and Parrot compete through compact aircraft design and automated flight support. Rotary-wing systems hold the strongest position because they match most urban and low-altitude missions.
- Rotary-Wing Use: Rotary-wing micro drones help police and rescue staff inspect alleys and rooftops without extra launch preparation.
- Fixed-Wing Demand: Fixed-wing micro drones suit farm scouts and land survey staff that track longer routes across open plots.
- Hybrid Adoption: Hybrid micro drones support premium field programs that require vertical takeoff plus longer travel between checkpoints.
Micro Drone Market Analysis by Application
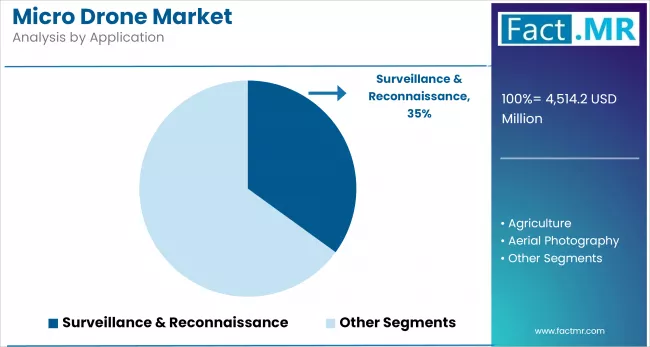
Surveillance & reconnaissance is expected to reach 35.0% share in 2026 as defense units and public safety coordinators need real-time observation. Agriculture uses micro drones for crop scouting and localized field review. Aerial video services are important because creators need portable aircraft for travel content. Industrial inspection grows as service providers replace ladders and manual site checks with small UAVs. Delivery services stay selective because payload limits restrict regular use.
- Surveillance Use: Micro drones help patrol check blind spots around buildings and temporary posts before ground movement begins.
- Agriculture Review: Farm service providers use micro drones to identify uneven crop growth across small plots before larger equipment enters.
- Inspection Work: Industrial contractors use micro drones to record roof damage and tower conditions without exposing technicians to risky access points.
Micro Drone Market Analysis by End-use
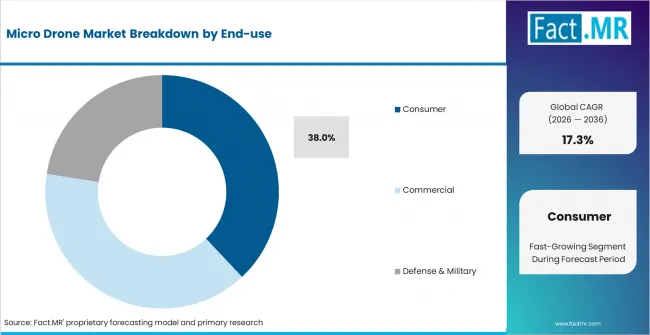
Micro drones are portable and easy to compare online. Creator demand supports recurring sales of camera-focused models. The consumer segment is projected to account for 38.0% share of micro drone demand by end-use in 2026 as travel video and recreational flying support compact drone purchases. Defense & military use carries higher system value because tactical users need secure links and field durability. Commercial users adopt micro drones for inspection and media work. Government and public safety agencies need training support before scaling programs.
- Consumer Imaging: Travel creators choose micro drones for quick setup and easy carrying during short trips and outdoor shoots.
- Defense Missions: Tactical units rely on rugged micro drones to check blind spots before patrol movement.
- Commercial Sites: Building inspectors deploy small UAVs to capture roof damage and façade defects before repair crews arrive.
Micro Drone Market Analysis by Range
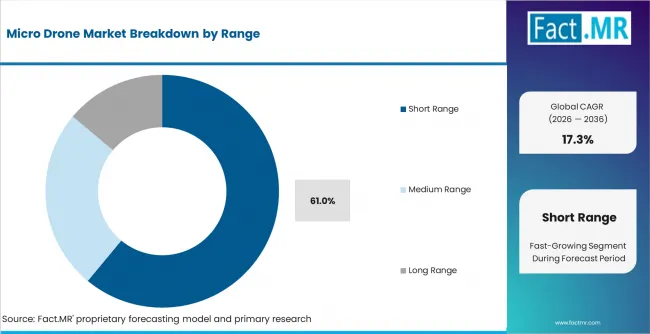
Short-range drones are projected to reach 61.0% share in 2026 as most missions happen close to the pilot. Local flight suits building inspection, public safety review, and creator filming. Medium-range drones support farm scouting and utility checks. Long-range micro drones require stronger batteries and communication links. Range choice affects cost and training effort. Short-range aircraft hold the clearest demand base because they match daily compact UAV use.
- Short-Range Use: Short-range micro drones help property inspectors finish roof and façade checks without complex route planning.
- Medium-Range Demand: Medium-range aircraft help agronomy staff compare field blocks and utility crews trace line faults across wider corridors.
- Long-Range Limits: Long-range models need stronger links and battery reserves before they can serve remote security patrols.
Micro Drone Market Analysis by Sales Channel
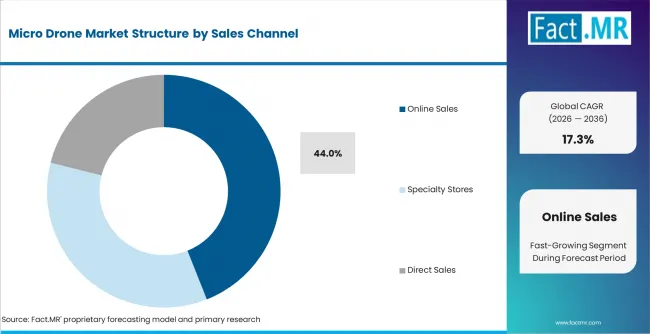
Online sales lead because consumer users compare camera quality and flight time before ordering. Specialty stores serve first-time operators who need demonstrations and local support. Online sales are projected to represent 44.0% share over the assessment period as lightweight drones are easy to ship and review digitally. Direct sales suit commercial and public safety programs that need training. Defense contracts follow a stricter path because documentation and field performance guide supplier selection.
- Online Sales: Digital marketplaces help micro drone users review spare batteries, camera resolution, and return terms before choosing a model.
- Specialty Stores: Specialty retailers help new pilots test control response and understand safe flying before purchase.
- Direct Supply: Direct channels help public safety align training and field use requirements before fleet rollout.
Micro Drone Market Drivers, Restraints, and Opportunities
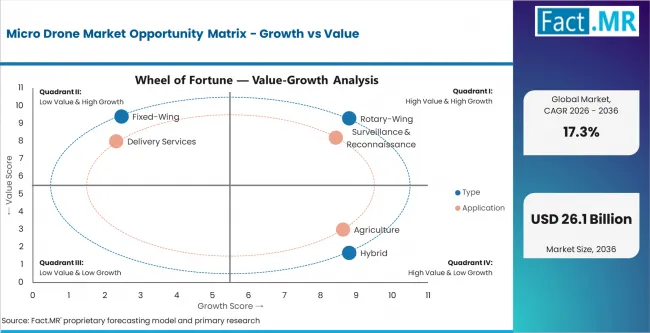
Fast visual review is the main demand driver for micro drones. Public safety coordinators need compact aircraft for emergency scenes. Defense planners need small UAVs for tactical observation. Inspection service providers need safer access to roofs and confined structures. Consumer creators need portable imaging devices that are simple to fly.
The main restraint is operational readiness. Battery life limits longer missions. Weather exposure can reduce flight reliability. Training needs slow public safety and inspection rollouts. Airspace approval can delay commercial use in urban areas. Supplier switching can be difficult because pilots and service staff often learn one control system. These limits make service support as important as aircraft price.
Opportunities in the Micro Drone Market
- Public Safety Programs: Public safety agencies can expand compact drone use through training-backed deployment and clearer flight accountability.
- Industrial Inspection: Inspection contractors can use micro drones to reduce manual access work across roofs and towers.
- Creator Devices: Consumer drone brands can grow through compact camera drones built for travel content and simple editing.
Regional Analysis
Based on regional analysis, the micro drone market is segmented into North America, Latin America, Western Europe, Eastern Europe, East Asia, South Asia and Pacific, and Middle East and Africa.
.webp)
| Country | CAGR (2026 to 2036) |
|---|---|
| United States | 22.4% |
| China | 22.0% |
| India | 21.6% |
| Germany | 20.8% |
| Japan | 20.4% |
| United Kingdom | 19.9% |
| Brazil | 18.8% |
Source: Fact.MR analysis, based on adjusted forecast model and primary research.
North America Micro Drone Market Analysis
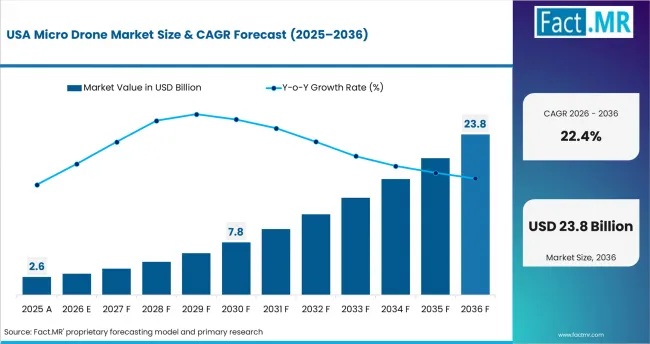
North America demand is supported by public safety programs and commercial inspection. The United States leads regional value because drone pilots work within established operating rules. FAA Remote ID improves accountability because compliant drones broadcast identification and location information during flight. This supports wider professional UAV use in public safety and inspection work.
- United States: Public safety agencies and commercial pilots support micro drone demand in the United States. The country is forecast to record 22.4% CAGR from 2026 to 2036 as emergency response, inspection, and creator use expand. Suppliers that combine aircraft reliability with training support can protect repeat sales among smaller public agencies.
East Asia Micro Drone Market Analysis
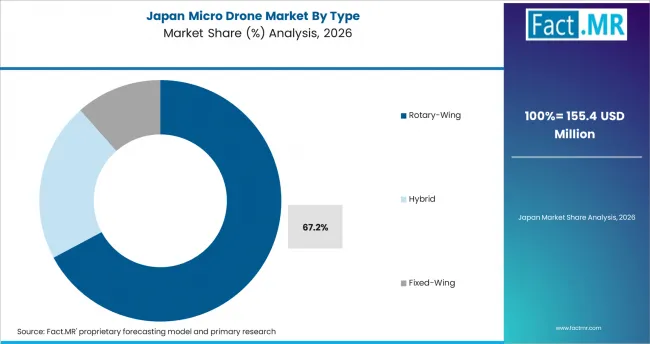
East Asia demand is shaped by production scale and electronics supply strength. China leads by manufacturing depth and domestic use across smart city monitoring. Japan supports higher-specification micro drone use across agriculture and infrastructure inspection.
- China: China’s micro drone demand is tied to domestic manufacturing scale and public monitoring programs. Smart city work and infrastructure review support the country’s 22.0% CAGR by 2036. CAAC’s UAV identification standards support safer monitoring of unmanned aircraft operations. [2] Local component access helps suppliers manage cost and serve consumer demand.
- Japan: Japan is projected to record 20.4% CAGR over the study period as agriculture support and infrastructure inspection lift micro drone use. Field operators need compact aircraft to reduce manual review across farms and transport assets. Disaster assessment creates another demand pocket for public agencies. Supplier acceptance depends on flight safety, battery quality, and documented service support.
South Asia and Pacific Micro Drone Market Analysis
South Asia and Pacific demand benefits from defense surveillance drone production. India leads the region because public agencies and defense units need compact UAVs for quick field review.
- India: India micro drone demand is forecast to grow at 21.6% CAGR from 2026 to 2036 as local production and military defense surveillance needs expand. Public agencies need compact UAVs for fast field review. India’s regulated drone ecosystem supports pilot training and wider formal adoption. [3] Service quality and pilot readiness will shape repeat demand across public and commercial programs.
Western Europe Micro Drone Market Analysis
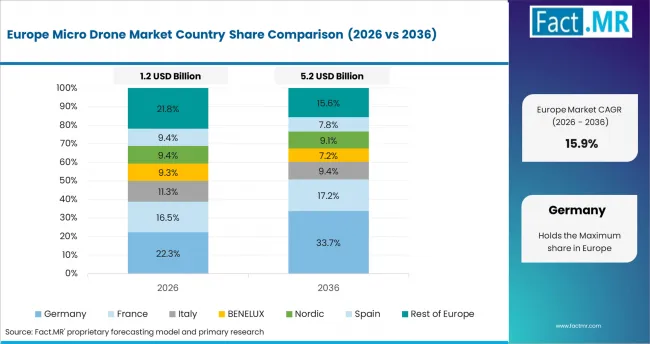
Western Europe demand reflects regulated flight use and industrial inspection. Germany leads through factory inspection and infrastructure review. The United Kingdom supports demand through public safety programs and professional drone services.
- Germany: Industrial inspection users are increasing compact drone adoption across Germany. The country is projected to grow at 20.8% CAGR through 2036 as plant review and infrastructure checks require safer visual tools. EASA’s work on drone authorization supports clearer operating pathways for regulated users. [4] Training support can improve adoption among industrial operators.
- United Kingdom: United Kingdom demand is likely to rise at 19.9% CAGR from 2026 to 2036 as public safety agencies and inspection contractors expand professional drone use. Micro drones suit emergency review, utility inspection, and creator imaging. UK operators need clear risk assessment processes before scaling professional flights. Supplier support will influence repeat adoption.
Latin America Micro Drone Market Analysis
Latin America demand is moving through agriculture, public safety, and infrastructure review. Brazil is the main opportunity because farms and industrial operators need visual monitoring across large sites.
- Brazil: Brazil records 18.8% CAGR from 2026 to 2036 as agriculture monitoring and defense modernization support micro drone adoption. Farm service providers use compact UAVs for crop review. DECEA’s authorization framework makes flight planning and airspace compliance important for professional drone use. [5] Supplier success will depend on local service coverage and repair access.
Competitive Aligners for Market Players
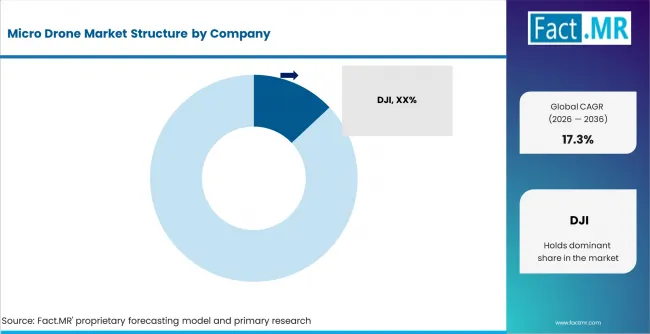
The micro drone market includes consumer drone brands, defense UAV suppliers, and autonomy-focused aircraft developers. DJI, AeroVironment, Parrot, Skydio, Teledyne FLIR, Lockheed Martin, Northrop Grumman, Yuneec, ideaForge Technology Limited, and Delair compete through aircraft design, sensor quality, flight safety, and service reach.
Competitive strength comes from stable flight controls and battery reliability. DJI introduced the Mavic 4 Pro in May 2025 with a 100MP Hasselblad sensor and 51-minute maximum flight time. Skydio positions X10 around autonomous flight and rapid deployment. Teledyne FLIR’s Black Hornet 4 supports defense reconnaissance through a lightweight nano-drone design.
Supplier position will rely on service depth through 2036. Public safety coordinators need training and repair support. Defense users need secure systems and field durability. Creator users need camera quality and easy controls. Companies that combine compact design with dependable after-sales support can protect repeat demand.
Key Players in Micro Drone Market
DJI
• AeroVironment, Inc.
• Parrot SA
• Skydio, Inc.
• Teledyne FLIR LLC
• Lockheed Martin Corporation
• Northrop Grumman Corporation
• Yuneec International
• ideaForge Technology Limited
• Delair
Bibliography
- [1]. Federal Aviation Administration. (2025). Remote Identification of Drones. Federal Aviation Administration.
- [2]. Civil Aviation Administration of China. (2025, December 24). CAAC Releases Two Mandatory National Standards for UAV. Civil Aviation Administration of China.
- [3]. Press Information Bureau. (2026, February 17). India’s Drone Ecosystem. Government of India.
- [4]. European Union Aviation Safety Agency. (2025, October 9). EASA presses on the accelerator to support drone operations in the EU. European Union Aviation Safety Agency.
- [5]. Department of Airspace Control. (2025, November 3). AIC 25/2025. Departamento de Controle do Espaço Aéreo.
Micro Drone Market Definition
The micro drone market covers compact unmanned aerial systems used for short-range flight and close visual review. The market differs from larger UAV systems because demand is measured through small aircraft that support portable imaging, and low-altitude monitoring. It includes drone hardware, integrated sensors, and packaged aircraft systems supplied for professional and consumer use.
Micro Drone Market Inclusions
The scope includes fixed-wing, rotary-wing, and hybrid micro drones used in surveillance, agriculture, and environmental monitoring. Consumer micro drones and professional-grade compact UAVs are included. Short-range and medium-range aircraft are covered. Online sales, and defense contracts are part of scope.
Micro Drone Market Exclusions
The scope excludes large military UAVs and passenger drones. Drone taxis and heavy-payload cargo drones are outside scope because their certification path, and operating cost differ from micro drones. Counter-drone systems are excluded because they detect or stop UAVs rather than support micro drone deployment. Standalone drone analytics software without aircraft supply is not counted.
Micro Drone Market Research Methodology
- Primary Research
- Primary research includes interviews with drone program managers and public safety UAV coordinators. Defense contract officers and inspection service providers are covered separately. Retail channel feedback supports product-level demand checks.
- Desk Research
- Desk research reviews drone rules and product catalogues. Supplier portfolios and aviation safety references support validation. Application data is compared with short-range flight use patterns.
- Market-Sizing and Forecasting
- Forecasting uses type demand and application adoption. Surveillance and consumer imaging demand are linked to aircraft portability and safe flight requirements.
- Data Validation and Update Cycle
- Forecasts are validated through supplier checks and distributor interviews. Regional assumptions are reviewed with drone rule updates and customer qualification needs.
Scope of the Report

| Attribute | Details |
| Quantitative Units | USD 5.3 billion in 2026 to USD 26.1 billion by 2036, at 17.3% CAGR |
| Market Definition | Compact unmanned aerial systems used for short-range visual review and portable monitoring. |
| Type | Fixed-Wing / Rotary-Wing / Hybrid |
| Application | Surveillance & Reconnaissance / Agriculture / Aerial Photography / Industrial Inspection / Delivery Services / Environmental Monitoring |
| End-use | Defense & Military / Commercial / Consumer / Government & Public Safety |
| Range | Short Range / Medium Range / Long Range |
| Sales Channel | Online Sales / Specialty Stores / Direct Sales / Defense Contracts |
| Regions Covered | North America / Latin America / Western Europe / Eastern Europe / East Asia / South Asia and Pacific / Middle East and Africa |
| Countries Covered | India / China / Germany / United States / Canada / Japan / France / United Kingdom / Brazil / GCC Countries |
| Key Companies Profiled | DJI / AeroVironment, Inc. / Parrot SA / Skydio, Inc. / Teledyne FLIR LLC / Lockheed Martin Corporation / Northrop Grumman Corporation / Yuneec International / ideaForge Technology Limited / Delair |
| Forecast Period | 2026 to 2036 |
| Approach | Hybrid top-down and bottom-up model using type demand, application demand, range mix, channel checks, and supplier validation. |
Micro Drone Market Analysis by Segments
-
By Type:
- Fixed-Wing
- Rotary-Wing
- Hybrid
-
By Application:
- Surveillance & Reconnaissance
- Agriculture
- Aerial Photography
- Industrial Inspection
- Delivery Services
- Environmental Monitoring
-
By End-use:
- Defense & Military
- Commercial
- Consumer
- Government & Public Safety
-
By Range:
- Short Range
- Medium Range
- Long Range
-
By Sales Channel:
- Online Sales
- Specialty Stores
- Direct Sales
- Defense Contracts
-
Region:
- North America
- United States
- Canada
- Europe
- Germany
- United Kingdom
- France
- Italy
- Spain
- Asia Pacific
- China
- Japan
- South Korea
- Taiwan
- Singapore
- Latin America
- Brazil
- Mexico
- Argentina
- Middle East & Africa
- GCC Countries
- South Africa
- Israel
- North America
- Frequently Asked Questions -
How large is the micro drone market in 2025?
The micro drone market was valued at USD 4.5 billion in 2025 based on Fact.MR’s public base and adjusted growth assumptions
What is the expected value of the micro drone market in 2026?
The micro drone market is estimated to reach USD 5.3 billion in 2026 through defense surveillance and consumer imaging demand.
What is the forecast value of the micro drone market by 2036?
The micro drone market is forecast to reach USD 26.1 billion by 2036 as compact UAV use expands.
What CAGR is projected for the micro drone market from 2026 to 2036?
Fact.MR’s adjusted forecast projects 17.3% CAGR for the micro drone market from 2026 to 2036.
Which type leads the micro drone market?
Rotary-wing micro drones lead the micro drone market with 70.0% share in the Fact.MR base.
Why do rotary-wing micro drones lead the micro drone market?
Rotary-wing micro drones lead because vertical takeoff and hovering support inspection, public safety, and creator filming.
Which application leads the micro drone market?
Surveillance & reconnaissance leads the micro drone market with 35.0% share in the Fact.MR base
Why does surveillance & reconnaissance lead the micro drone market?
Surveillance & reconnaissance leads because defense and public safety users need fast aerial review with compact aircraft.
Which end-use leads the micro drone market?
Consumer use leads directionally because creators and recreational pilots need portable camera drones with simple controls.
Which range leads the micro drone market?
Short-range drones lead directionally because most micro drone missions happen close to the pilot.
Which sales channel leads the micro drone market?
Online sales lead directionally because consumer drone users compare camera quality and flight time before purchase.
Which country is growing fastest in the micro drone market?
India is forecast to grow fastest at 20.1% CAGR from 2026 to 2036.
Why is India growing fastest in the micro drone market?
India grows fastest because local drone manufacturing and defense surveillance needs support compact UAV adoption.
Which companies compete in the micro drone market?
DJI, AeroVironment, Parrot, Skydio, Teledyne FLIR, Lockheed Martin, Northrop Grumman, ideaForge, and Delair compete in this market.
What is included in the micro drone market scope?
The scope includes compact UAV systems, integrated sensors, batteries, controllers, and packaged micro drone platforms.
What is excluded from the micro drone market scope?
The scope excludes passenger drones, large UAV systems, drone taxis, counter-drone systems, and standalone analytics software.
How does Fact.MR forecast micro drone market demand?
Fact.MR forecasts demand using type mix, application demand, range adoption, sales channel checks, and supplier validation.
Table of Content
- Executive Summary
- Global Market Outlook
- Demand to side Trends
- Supply to side Trends
- Technology Roadmap Analysis
- Analysis and Recommendations
- Market Overview
- Market Coverage / Taxonomy
- Market Definition / Scope / Limitations
- Research Methodology
- Chapter Orientation
- Analytical Lens and Working Hypotheses
- Market Structure, Signals, and Trend Drivers
- Benchmarking and Cross-market Comparability
- Market Sizing, Forecasting, and Opportunity Mapping
- Research Design and Evidence Framework
- Desk Research Programme (Secondary Evidence)
- Company Annual and Sustainability Reports
- Peer-reviewed Journals and Academic Literature
- Corporate Websites, Product Literature, and Technical Notes
- Earnings Decks and Investor Briefings
- Statutory Filings and Regulatory Disclosures
- Technical White Papers and Standards Notes
- Trade Journals, Industry Magazines, and Analyst Briefs
- Conference Proceedings, Webinars, and Seminar Materials
- Government Statistics Portals and Public Data Releases
- Press Releases and Reputable Media Coverage
- Specialist Newsletters and Curated Briefings
- Sector Databases and Reference Repositories
- Fact.MR Internal Proprietary Databases and Historical Market Datasets
- Subscription Datasets and Paid Sources
- Social Channels, Communities, and Digital Listening Inputs
- Additional Desk Sources
- Expert Input and Fieldwork (Primary Evidence)
- Primary Modes
- Qualitative Interviews and Expert Elicitation
- Quantitative Surveys and Structured Data Capture
- Blended Approach
- Why Primary Evidence is Used
- Field Techniques
- Interviews
- Surveys
- Focus Groups
- Observational and In-context Research
- Social and Community Interactions
- Stakeholder Universe Engaged
- C-suite Leaders
- Board Members
- Presidents and Vice Presidents
- R&D and Innovation Heads
- Technical Specialists
- Domain Subject-matter Experts
- Scientists
- Physicians and Other Healthcare Professionals
- Governance, Ethics, and Data Stewardship
- Research Ethics
- Data Integrity and Handling
- Primary Modes
- Tooling, Models, and Reference Databases
- Desk Research Programme (Secondary Evidence)
- Data Engineering and Model Build
- Data Acquisition and Ingestion
- Cleaning, Normalisation, and Verification
- Synthesis, Triangulation, and Analysis
- Quality Assurance and Audit Trail
- Market Background
- Market Dynamics
- Drivers
- Restraints
- Opportunity
- Trends
- Scenario Forecast
- Demand in Optimistic Scenario
- Demand in Likely Scenario
- Demand in Conservative Scenario
- Opportunity Map Analysis
- Product Life Cycle Analysis
- Supply Chain Analysis
- Investment Feasibility Matrix
- Value Chain Analysis
- PESTLE and Porter’s Analysis
- Regulatory Landscape
- Regional Parent Market Outlook
- Production and Consumption Statistics
- Import and Export Statistics
- Market Dynamics
- Global Market Analysis 2021 to 2025 and Forecast, 2026 to 2036
- Historical Market Size Value (USD Million) Analysis, 2021 to 2025
- Current and Future Market Size Value (USD Million) Projections, 2026 to 2036
- Y to o to Y Growth Trend Analysis
- Absolute $ Opportunity Analysis
- Global Market Pricing Analysis 2021 to 2025 and Forecast 2026 to 2036
- Global Market Analysis 2021 to 2025 and Forecast 2026 to 2036, By Type
- Introduction / Key Findings
- Historical Market Size Value (USD Million) Analysis By Type , 2021 to 2025
- Current and Future Market Size Value (USD Million) Analysis and Forecast By Type , 2026 to 2036
- Rotary-Wing
- Hybrid
- Fixed-Wing
- Rotary-Wing
- Y to o to Y Growth Trend Analysis By Type , 2021 to 2025
- Absolute $ Opportunity Analysis By Type , 2026 to 2036
- Global Market Analysis 2021 to 2025 and Forecast 2026 to 2036, By Application
- Introduction / Key Findings
- Historical Market Size Value (USD Million) Analysis By Application, 2021 to 2025
- Current and Future Market Size Value (USD Million) Analysis and Forecast By Application, 2026 to 2036
- Surveillance & Reconnaissance
- Agriculture
- Delivery Services
- Surveillance & Reconnaissance
- Y to o to Y Growth Trend Analysis By Application, 2021 to 2025
- Absolute $ Opportunity Analysis By Application, 2026 to 2036
- Global Market Analysis 2021 to 2025 and Forecast 2026 to 2036, By End-use
- Introduction / Key Findings
- Historical Market Size Value (USD Million) Analysis By End-use, 2021 to 2025
- Current and Future Market Size Value (USD Million) Analysis and Forecast By End-use, 2026 to 2036
- Consumer
- Commercial
- Defense & Military
- Consumer
- Y to o to Y Growth Trend Analysis By End-use, 2021 to 2025
- Absolute $ Opportunity Analysis By End-use, 2026 to 2036
- Global Market Analysis 2021 to 2025 and Forecast 2026 to 2036, By Range
- Introduction / Key Findings
- Historical Market Size Value (USD Million) Analysis By Range, 2021 to 2025
- Current and Future Market Size Value (USD Million) Analysis and Forecast By Range, 2026 to 2036
- Short Range
- Medium Range
- Long Range
- Short Range
- Y to o to Y Growth Trend Analysis By Range, 2021 to 2025
- Absolute $ Opportunity Analysis By Range, 2026 to 2036
- Global Market Analysis 2021 to 2025 and Forecast 2026 to 2036, By Sales Channel
- Introduction / Key Findings
- Historical Market Size Value (USD Million) Analysis By Sales Channel, 2021 to 2025
- Current and Future Market Size Value (USD Million) Analysis and Forecast By Sales Channel, 2026 to 2036
- Online Sales
- Specialty Stores
- Direct Sales
- Online Sales
- Y to o to Y Growth Trend Analysis By Sales Channel, 2021 to 2025
- Absolute $ Opportunity Analysis By Sales Channel, 2026 to 2036
- Global Market Analysis 2021 to 2025 and Forecast 2026 to 2036, By Region
- Introduction
- Historical Market Size Value (USD Million) Analysis By Region, 2021 to 2025
- Current Market Size Value (USD Million) Analysis and Forecast By Region, 2026 to 2036
- North America
- Latin America
- Western Europe
- Eastern Europe
- East Asia
- South Asia and Pacific
- Middle East & Africa
- Market Attractiveness Analysis By Region
- North America Market Analysis 2021 to 2025 and Forecast 2026 to 2036, By Country
- Historical Market Size Value (USD Million) Trend Analysis By Market Taxonomy, 2021 to 2025
- Market Size Value (USD Million) Forecast By Market Taxonomy, 2026 to 2036
- By Country
- USA
- Canada
- Mexico
- By Type
- By Application
- By End-use
- By Range
- By Sales Channel
- By Country
- Market Attractiveness Analysis
- By Country
- By Type
- By Application
- By End-use
- By Range
- By Sales Channel
- Key Takeaways
- Latin America Market Analysis 2021 to 2025 and Forecast 2026 to 2036, By Country
- Historical Market Size Value (USD Million) Trend Analysis By Market Taxonomy, 2021 to 2025
- Market Size Value (USD Million) Forecast By Market Taxonomy, 2026 to 2036
- By Country
- Brazil
- Chile
- Rest of Latin America
- By Type
- By Application
- By End-use
- By Range
- By Sales Channel
- By Country
- Market Attractiveness Analysis
- By Country
- By Type
- By Application
- By End-use
- By Range
- By Sales Channel
- Key Takeaways
- Western Europe Market Analysis 2021 to 2025 and Forecast 2026 to 2036, By Country
- Historical Market Size Value (USD Million) Trend Analysis By Market Taxonomy, 2021 to 2025
- Market Size Value (USD Million) Forecast By Market Taxonomy, 2026 to 2036
- By Country
- Germany
- UK
- Italy
- Spain
- France
- Nordic
- BENELUX
- Rest of Western Europe
- By Type
- By Application
- By End-use
- By Range
- By Sales Channel
- By Country
- Market Attractiveness Analysis
- By Country
- By Type
- By Application
- By End-use
- By Range
- By Sales Channel
- Key Takeaways
- Eastern Europe Market Analysis 2021 to 2025 and Forecast 2026 to 2036, By Country
- Historical Market Size Value (USD Million) Trend Analysis By Market Taxonomy, 2021 to 2025
- Market Size Value (USD Million) Forecast By Market Taxonomy, 2026 to 2036
- By Country
- Russia
- Poland
- Hungary
- Balkan & Baltic
- Rest of Eastern Europe
- By Type
- By Application
- By End-use
- By Range
- By Sales Channel
- By Country
- Market Attractiveness Analysis
- By Country
- By Type
- By Application
- By End-use
- By Range
- By Sales Channel
- Key Takeaways
- East Asia Market Analysis 2021 to 2025 and Forecast 2026 to 2036, By Country
- Historical Market Size Value (USD Million) Trend Analysis By Market Taxonomy, 2021 to 2025
- Market Size Value (USD Million) Forecast By Market Taxonomy, 2026 to 2036
- By Country
- China
- Japan
- South Korea
- By Type
- By Application
- By End-use
- By Range
- By Sales Channel
- By Country
- Market Attractiveness Analysis
- By Country
- By Type
- By Application
- By End-use
- By Range
- By Sales Channel
- Key Takeaways
- South Asia and Pacific Market Analysis 2021 to 2025 and Forecast 2026 to 2036, By Country
- Historical Market Size Value (USD Million) Trend Analysis By Market Taxonomy, 2021 to 2025
- Market Size Value (USD Million) Forecast By Market Taxonomy, 2026 to 2036
- By Country
- India
- ASEAN
- Australia & New Zealand
- Rest of South Asia and Pacific
- By Type
- By Application
- By End-use
- By Range
- By Sales Channel
- By Country
- Market Attractiveness Analysis
- By Country
- By Type
- By Application
- By End-use
- By Range
- By Sales Channel
- Key Takeaways
- Middle East & Africa Market Analysis 2021 to 2025 and Forecast 2026 to 2036, By Country
- Historical Market Size Value (USD Million) Trend Analysis By Market Taxonomy, 2021 to 2025
- Market Size Value (USD Million) Forecast By Market Taxonomy, 2026 to 2036
- By Country
- Kingdom of Saudi Arabia
- Other GCC Countries
- Turkiye
- South Africa
- Other African Union
- Rest of Middle East & Africa
- By Type
- By Application
- By End-use
- By Range
- By Sales Channel
- By Country
- Market Attractiveness Analysis
- By Country
- By Type
- By Application
- By End-use
- By Range
- By Sales Channel
- Key Takeaways
- Key Countries Market Analysis
- USA
- Pricing Analysis
- Market Share Analysis, 2025
- By Type
- By Application
- By End-use
- By Range
- By Sales Channel
- Canada
- Pricing Analysis
- Market Share Analysis, 2025
- By Type
- By Application
- By End-use
- By Range
- By Sales Channel
- Mexico
- Pricing Analysis
- Market Share Analysis, 2025
- By Type
- By Application
- By End-use
- By Range
- By Sales Channel
- Brazil
- Pricing Analysis
- Market Share Analysis, 2025
- By Type
- By Application
- By End-use
- By Range
- By Sales Channel
- Chile
- Pricing Analysis
- Market Share Analysis, 2025
- By Type
- By Application
- By End-use
- By Range
- By Sales Channel
- Germany
- Pricing Analysis
- Market Share Analysis, 2025
- By Type
- By Application
- By End-use
- By Range
- By Sales Channel
- UK
- Pricing Analysis
- Market Share Analysis, 2025
- By Type
- By Application
- By End-use
- By Range
- By Sales Channel
- Italy
- Pricing Analysis
- Market Share Analysis, 2025
- By Type
- By Application
- By End-use
- By Range
- By Sales Channel
- Spain
- Pricing Analysis
- Market Share Analysis, 2025
- By Type
- By Application
- By End-use
- By Range
- By Sales Channel
- France
- Pricing Analysis
- Market Share Analysis, 2025
- By Type
- By Application
- By End-use
- By Range
- By Sales Channel
- India
- Pricing Analysis
- Market Share Analysis, 2025
- By Type
- By Application
- By End-use
- By Range
- By Sales Channel
- ASEAN
- Pricing Analysis
- Market Share Analysis, 2025
- By Type
- By Application
- By End-use
- By Range
- By Sales Channel
- Australia & New Zealand
- Pricing Analysis
- Market Share Analysis, 2025
- By Type
- By Application
- By End-use
- By Range
- By Sales Channel
- China
- Pricing Analysis
- Market Share Analysis, 2025
- By Type
- By Application
- By End-use
- By Range
- By Sales Channel
- Japan
- Pricing Analysis
- Market Share Analysis, 2025
- By Type
- By Application
- By End-use
- By Range
- By Sales Channel
- South Korea
- Pricing Analysis
- Market Share Analysis, 2025
- By Type
- By Application
- By End-use
- By Range
- By Sales Channel
- Russia
- Pricing Analysis
- Market Share Analysis, 2025
- By Type
- By Application
- By End-use
- By Range
- By Sales Channel
- Poland
- Pricing Analysis
- Market Share Analysis, 2025
- By Type
- By Application
- By End-use
- By Range
- By Sales Channel
- Hungary
- Pricing Analysis
- Market Share Analysis, 2025
- By Type
- By Application
- By End-use
- By Range
- By Sales Channel
- Kingdom of Saudi Arabia
- Pricing Analysis
- Market Share Analysis, 2025
- By Type
- By Application
- By End-use
- By Range
- By Sales Channel
- Turkiye
- Pricing Analysis
- Market Share Analysis, 2025
- By Type
- By Application
- By End-use
- By Range
- By Sales Channel
- South Africa
- Pricing Analysis
- Market Share Analysis, 2025
- By Type
- By Application
- By End-use
- By Range
- By Sales Channel
- USA
- Market Structure Analysis
- Competition Dashboard
- Competition Benchmarking
- Market Share Analysis of Top Players
- By Regional
- By Type
- By Application
- By End-use
- By Range
- By Sales Channel
- Competition Analysis
- Competition Deep Dive
- DJI
- Overview
- Product Portfolio
- Profitability by Market Segments (Product/Age /Sales Channel/Region)
- Sales Footprint
- Strategy Overview
- Marketing Strategy
- Product Strategy
- Channel Strategy
- AeroVironment, Inc.
- Parrot SA
- Skydio, Inc.
- Teledyne FLIR LLC
- Lockheed Martin Corporation
- Northrop Grumman Corporation
- DJI
- Competition Deep Dive
- Assumptions & Acronyms Used
List Of Table
- Table 1: Global Market Value (USD Million) Forecast by Region, 2021 to 2036
- Table 2: Global Market Value (USD Million) Forecast by Type, 2021 to 2036
- Table 3: Global Market Value (USD Million) Forecast by Application, 2021 to 2036
- Table 4: Global Market Value (USD Million) Forecast by End-use, 2021 to 2036
- Table 5: Global Market Value (USD Million) Forecast by Range, 2021 to 2036
- Table 6: Global Market Value (USD Million) Forecast by Sales Channel, 2021 to 2036
- Table 7: North America Market Value (USD Million) Forecast by Country, 2021 to 2036
- Table 8: North America Market Value (USD Million) Forecast by Type, 2021 to 2036
- Table 9: North America Market Value (USD Million) Forecast by Application, 2021 to 2036
- Table 10: North America Market Value (USD Million) Forecast by End-use, 2021 to 2036
- Table 11: North America Market Value (USD Million) Forecast by Range, 2021 to 2036
- Table 12: North America Market Value (USD Million) Forecast by Sales Channel, 2021 to 2036
- Table 13: Latin America Market Value (USD Million) Forecast by Country, 2021 to 2036
- Table 14: Latin America Market Value (USD Million) Forecast by Type, 2021 to 2036
- Table 15: Latin America Market Value (USD Million) Forecast by Application, 2021 to 2036
- Table 16: Latin America Market Value (USD Million) Forecast by End-use, 2021 to 2036
- Table 17: Latin America Market Value (USD Million) Forecast by Range, 2021 to 2036
- Table 18: Latin America Market Value (USD Million) Forecast by Sales Channel, 2021 to 2036
- Table 19: Western Europe Market Value (USD Million) Forecast by Country, 2021 to 2036
- Table 20: Western Europe Market Value (USD Million) Forecast by Type, 2021 to 2036
- Table 21: Western Europe Market Value (USD Million) Forecast by Application, 2021 to 2036
- Table 22: Western Europe Market Value (USD Million) Forecast by End-use, 2021 to 2036
- Table 23: Western Europe Market Value (USD Million) Forecast by Range, 2021 to 2036
- Table 24: Western Europe Market Value (USD Million) Forecast by Sales Channel, 2021 to 2036
- Table 25: Eastern Europe Market Value (USD Million) Forecast by Country, 2021 to 2036
- Table 26: Eastern Europe Market Value (USD Million) Forecast by Type, 2021 to 2036
- Table 27: Eastern Europe Market Value (USD Million) Forecast by Application, 2021 to 2036
- Table 28: Eastern Europe Market Value (USD Million) Forecast by End-use, 2021 to 2036
- Table 29: Eastern Europe Market Value (USD Million) Forecast by Range, 2021 to 2036
- Table 30: Eastern Europe Market Value (USD Million) Forecast by Sales Channel, 2021 to 2036
- Table 31: East Asia Market Value (USD Million) Forecast by Country, 2021 to 2036
- Table 32: East Asia Market Value (USD Million) Forecast by Type, 2021 to 2036
- Table 33: East Asia Market Value (USD Million) Forecast by Application, 2021 to 2036
- Table 34: East Asia Market Value (USD Million) Forecast by End-use, 2021 to 2036
- Table 35: East Asia Market Value (USD Million) Forecast by Range, 2021 to 2036
- Table 36: East Asia Market Value (USD Million) Forecast by Sales Channel, 2021 to 2036
- Table 37: South Asia and Pacific Market Value (USD Million) Forecast by Country, 2021 to 2036
- Table 38: South Asia and Pacific Market Value (USD Million) Forecast by Type, 2021 to 2036
- Table 39: South Asia and Pacific Market Value (USD Million) Forecast by Application, 2021 to 2036
- Table 40: South Asia and Pacific Market Value (USD Million) Forecast by End-use, 2021 to 2036
- Table 41: South Asia and Pacific Market Value (USD Million) Forecast by Range, 2021 to 2036
- Table 42: South Asia and Pacific Market Value (USD Million) Forecast by Sales Channel, 2021 to 2036
- Table 43: Middle East & Africa Market Value (USD Million) Forecast by Country, 2021 to 2036
- Table 44: Middle East & Africa Market Value (USD Million) Forecast by Type, 2021 to 2036
- Table 45: Middle East & Africa Market Value (USD Million) Forecast by Application, 2021 to 2036
- Table 46: Middle East & Africa Market Value (USD Million) Forecast by End-use, 2021 to 2036
- Table 47: Middle East & Africa Market Value (USD Million) Forecast by Range, 2021 to 2036
- Table 48: Middle East & Africa Market Value (USD Million) Forecast by Sales Channel, 2021 to 2036
List Of Figures
- Figure 1: Global Market Pricing Analysis
- Figure 2: Global Market Value (USD Million) Forecast 2021-2036
- Figure 3: Global Market Value Share and BPS Analysis by Type, 2026 and 2036
- Figure 4: Global Market Y-o-Y Growth Comparison by Type, 2026 to 2036
- Figure 5: Global Market Attractiveness Analysis by Type
- Figure 6: Global Market Value Share and BPS Analysis by Application, 2026 and 2036
- Figure 7: Global Market Y-o-Y Growth Comparison by Application, 2026 to 2036
- Figure 8: Global Market Attractiveness Analysis by Application
- Figure 9: Global Market Value Share and BPS Analysis by End-use, 2026 and 2036
- Figure 10: Global Market Y-o-Y Growth Comparison by End-use, 2026 to 2036
- Figure 11: Global Market Attractiveness Analysis by End-use
- Figure 12: Global Market Value Share and BPS Analysis by Range, 2026 and 2036
- Figure 13: Global Market Y-o-Y Growth Comparison by Range, 2026 to 2036
- Figure 14: Global Market Attractiveness Analysis by Range
- Figure 15: Global Market Value Share and BPS Analysis by Sales Channel, 2026 and 2036
- Figure 16: Global Market Y-o-Y Growth Comparison by Sales Channel, 2026 to 2036
- Figure 17: Global Market Attractiveness Analysis by Sales Channel
- Figure 18: Global Market Value (USD Million) Share and BPS Analysis by Region, 2026 and 2036
- Figure 19: Global Market Y-o-Y Growth Comparison by Region, 2026 to 2036
- Figure 20: Global Market Attractiveness Analysis by Region
- Figure 21: North America Market Incremental Dollar Opportunity, 2026 to 2036
- Figure 22: Latin America Market Incremental Dollar Opportunity, 2026 to 2036
- Figure 23: Western Europe Market Incremental Dollar Opportunity, 2026 to 2036
- Figure 24: Eastern Europe Market Incremental Dollar Opportunity, 2026 to 2036
- Figure 25: East Asia Market Incremental Dollar Opportunity, 2026 to 2036
- Figure 26: South Asia and Pacific Market Incremental Dollar Opportunity, 2026 to 2036
- Figure 27: Middle East & Africa Market Incremental Dollar Opportunity, 2026 to 2036
- Figure 28: North America Market Value Share and BPS Analysis by Country, 2026 and 2036
- Figure 29: North America Market Value Share and BPS Analysis by Type, 2026 and 2036
- Figure 30: North America Market Y-o-Y Growth Comparison by Type, 2026 to 2036
- Figure 31: North America Market Attractiveness Analysis by Type
- Figure 32: North America Market Value Share and BPS Analysis by Application, 2026 and 2036
- Figure 33: North America Market Y-o-Y Growth Comparison by Application, 2026 to 2036
- Figure 34: North America Market Attractiveness Analysis by Application
- Figure 35: North America Market Value Share and BPS Analysis by End-use, 2026 and 2036
- Figure 36: North America Market Y-o-Y Growth Comparison by End-use, 2026 to 2036
- Figure 37: North America Market Attractiveness Analysis by End-use
- Figure 38: North America Market Value Share and BPS Analysis by Range, 2026 and 2036
- Figure 39: North America Market Y-o-Y Growth Comparison by Range, 2026 to 2036
- Figure 40: North America Market Attractiveness Analysis by Range
- Figure 41: North America Market Value Share and BPS Analysis by Sales Channel, 2026 and 2036
- Figure 42: North America Market Y-o-Y Growth Comparison by Sales Channel, 2026 to 2036
- Figure 43: North America Market Attractiveness Analysis by Sales Channel
- Figure 44: Latin America Market Value Share and BPS Analysis by Country, 2026 and 2036
- Figure 45: Latin America Market Value Share and BPS Analysis by Type, 2026 and 2036
- Figure 46: Latin America Market Y-o-Y Growth Comparison by Type, 2026 to 2036
- Figure 47: Latin America Market Attractiveness Analysis by Type
- Figure 48: Latin America Market Value Share and BPS Analysis by Application, 2026 and 2036
- Figure 49: Latin America Market Y-o-Y Growth Comparison by Application, 2026 to 2036
- Figure 50: Latin America Market Attractiveness Analysis by Application
- Figure 51: Latin America Market Value Share and BPS Analysis by End-use, 2026 and 2036
- Figure 52: Latin America Market Y-o-Y Growth Comparison by End-use, 2026 to 2036
- Figure 53: Latin America Market Attractiveness Analysis by End-use
- Figure 54: Latin America Market Value Share and BPS Analysis by Range, 2026 and 2036
- Figure 55: Latin America Market Y-o-Y Growth Comparison by Range, 2026 to 2036
- Figure 56: Latin America Market Attractiveness Analysis by Range
- Figure 57: Latin America Market Value Share and BPS Analysis by Sales Channel, 2026 and 2036
- Figure 58: Latin America Market Y-o-Y Growth Comparison by Sales Channel, 2026 to 2036
- Figure 59: Latin America Market Attractiveness Analysis by Sales Channel
- Figure 60: Western Europe Market Value Share and BPS Analysis by Country, 2026 and 2036
- Figure 61: Western Europe Market Value Share and BPS Analysis by Type, 2026 and 2036
- Figure 62: Western Europe Market Y-o-Y Growth Comparison by Type, 2026 to 2036
- Figure 63: Western Europe Market Attractiveness Analysis by Type
- Figure 64: Western Europe Market Value Share and BPS Analysis by Application, 2026 and 2036
- Figure 65: Western Europe Market Y-o-Y Growth Comparison by Application, 2026 to 2036
- Figure 66: Western Europe Market Attractiveness Analysis by Application
- Figure 67: Western Europe Market Value Share and BPS Analysis by End-use, 2026 and 2036
- Figure 68: Western Europe Market Y-o-Y Growth Comparison by End-use, 2026 to 2036
- Figure 69: Western Europe Market Attractiveness Analysis by End-use
- Figure 70: Western Europe Market Value Share and BPS Analysis by Range, 2026 and 2036
- Figure 71: Western Europe Market Y-o-Y Growth Comparison by Range, 2026 to 2036
- Figure 72: Western Europe Market Attractiveness Analysis by Range
- Figure 73: Western Europe Market Value Share and BPS Analysis by Sales Channel, 2026 and 2036
- Figure 74: Western Europe Market Y-o-Y Growth Comparison by Sales Channel, 2026 to 2036
- Figure 75: Western Europe Market Attractiveness Analysis by Sales Channel
- Figure 76: Eastern Europe Market Value Share and BPS Analysis by Country, 2026 and 2036
- Figure 77: Eastern Europe Market Value Share and BPS Analysis by Type, 2026 and 2036
- Figure 78: Eastern Europe Market Y-o-Y Growth Comparison by Type, 2026 to 2036
- Figure 79: Eastern Europe Market Attractiveness Analysis by Type
- Figure 80: Eastern Europe Market Value Share and BPS Analysis by Application, 2026 and 2036
- Figure 81: Eastern Europe Market Y-o-Y Growth Comparison by Application, 2026 to 2036
- Figure 82: Eastern Europe Market Attractiveness Analysis by Application
- Figure 83: Eastern Europe Market Value Share and BPS Analysis by End-use, 2026 and 2036
- Figure 84: Eastern Europe Market Y-o-Y Growth Comparison by End-use, 2026 to 2036
- Figure 85: Eastern Europe Market Attractiveness Analysis by End-use
- Figure 86: Eastern Europe Market Value Share and BPS Analysis by Range, 2026 and 2036
- Figure 87: Eastern Europe Market Y-o-Y Growth Comparison by Range, 2026 to 2036
- Figure 88: Eastern Europe Market Attractiveness Analysis by Range
- Figure 89: Eastern Europe Market Value Share and BPS Analysis by Sales Channel, 2026 and 2036
- Figure 90: Eastern Europe Market Y-o-Y Growth Comparison by Sales Channel, 2026 to 2036
- Figure 91: Eastern Europe Market Attractiveness Analysis by Sales Channel
- Figure 92: East Asia Market Value Share and BPS Analysis by Country, 2026 and 2036
- Figure 93: East Asia Market Value Share and BPS Analysis by Type, 2026 and 2036
- Figure 94: East Asia Market Y-o-Y Growth Comparison by Type, 2026 to 2036
- Figure 95: East Asia Market Attractiveness Analysis by Type
- Figure 96: East Asia Market Value Share and BPS Analysis by Application, 2026 and 2036
- Figure 97: East Asia Market Y-o-Y Growth Comparison by Application, 2026 to 2036
- Figure 98: East Asia Market Attractiveness Analysis by Application
- Figure 99: East Asia Market Value Share and BPS Analysis by End-use, 2026 and 2036
- Figure 100: East Asia Market Y-o-Y Growth Comparison by End-use, 2026 to 2036
- Figure 101: East Asia Market Attractiveness Analysis by End-use
- Figure 102: East Asia Market Value Share and BPS Analysis by Range, 2026 and 2036
- Figure 103: East Asia Market Y-o-Y Growth Comparison by Range, 2026 to 2036
- Figure 104: East Asia Market Attractiveness Analysis by Range
- Figure 105: East Asia Market Value Share and BPS Analysis by Sales Channel, 2026 and 2036
- Figure 106: East Asia Market Y-o-Y Growth Comparison by Sales Channel, 2026 to 2036
- Figure 107: East Asia Market Attractiveness Analysis by Sales Channel
- Figure 108: South Asia and Pacific Market Value Share and BPS Analysis by Country, 2026 and 2036
- Figure 109: South Asia and Pacific Market Value Share and BPS Analysis by Type, 2026 and 2036
- Figure 110: South Asia and Pacific Market Y-o-Y Growth Comparison by Type, 2026 to 2036
- Figure 111: South Asia and Pacific Market Attractiveness Analysis by Type
- Figure 112: South Asia and Pacific Market Value Share and BPS Analysis by Application, 2026 and 2036
- Figure 113: South Asia and Pacific Market Y-o-Y Growth Comparison by Application, 2026 to 2036
- Figure 114: South Asia and Pacific Market Attractiveness Analysis by Application
- Figure 115: South Asia and Pacific Market Value Share and BPS Analysis by End-use, 2026 and 2036
- Figure 116: South Asia and Pacific Market Y-o-Y Growth Comparison by End-use, 2026 to 2036
- Figure 117: South Asia and Pacific Market Attractiveness Analysis by End-use
- Figure 118: South Asia and Pacific Market Value Share and BPS Analysis by Range, 2026 and 2036
- Figure 119: South Asia and Pacific Market Y-o-Y Growth Comparison by Range, 2026 to 2036
- Figure 120: South Asia and Pacific Market Attractiveness Analysis by Range
- Figure 121: South Asia and Pacific Market Value Share and BPS Analysis by Sales Channel, 2026 and 2036
- Figure 122: South Asia and Pacific Market Y-o-Y Growth Comparison by Sales Channel, 2026 to 2036
- Figure 123: South Asia and Pacific Market Attractiveness Analysis by Sales Channel
- Figure 124: Middle East & Africa Market Value Share and BPS Analysis by Country, 2026 and 2036
- Figure 125: Middle East & Africa Market Value Share and BPS Analysis by Type, 2026 and 2036
- Figure 126: Middle East & Africa Market Y-o-Y Growth Comparison by Type, 2026 to 2036
- Figure 127: Middle East & Africa Market Attractiveness Analysis by Type
- Figure 128: Middle East & Africa Market Value Share and BPS Analysis by Application, 2026 and 2036
- Figure 129: Middle East & Africa Market Y-o-Y Growth Comparison by Application, 2026 to 2036
- Figure 130: Middle East & Africa Market Attractiveness Analysis by Application
- Figure 131: Middle East & Africa Market Value Share and BPS Analysis by End-use, 2026 and 2036
- Figure 132: Middle East & Africa Market Y-o-Y Growth Comparison by End-use, 2026 to 2036
- Figure 133: Middle East & Africa Market Attractiveness Analysis by End-use
- Figure 134: Middle East & Africa Market Value Share and BPS Analysis by Range, 2026 and 2036
- Figure 135: Middle East & Africa Market Y-o-Y Growth Comparison by Range, 2026 to 2036
- Figure 136: Middle East & Africa Market Attractiveness Analysis by Range
- Figure 137: Middle East & Africa Market Value Share and BPS Analysis by Sales Channel, 2026 and 2036
- Figure 138: Middle East & Africa Market Y-o-Y Growth Comparison by Sales Channel, 2026 to 2036
- Figure 139: Middle East & Africa Market Attractiveness Analysis by Sales Channel
- Figure 140: Global Market - Tier Structure Analysis
- Figure 141: Global Market - Company Share Analysis