- Market Value (2025): USD 2.5 Bn
- Estimated Value (2026): USD 2.7 Bn
- Forecast Value (2036): USD 5.1 Bn
- CAGR (2026-2036): 6.6%
What is the Nutritive Sweeteners Market forecast to be worth by 2036?
USD 25.7 billion in 2026 to USD 39.9 billion by 2036 at 4.5% CAGR.
- The nutritive sweeteners market crossed a valuation of USD 24.6 billion in 2025.
- Demand is projected to increase from USD 25.7 billion in 2026 to USD 39.9 billion by 2036.
- The market is forecast to record a 4.5% CAGR from 2026 to 2036 as food and beverage processors retain caloric sweeteners in standard formulas.
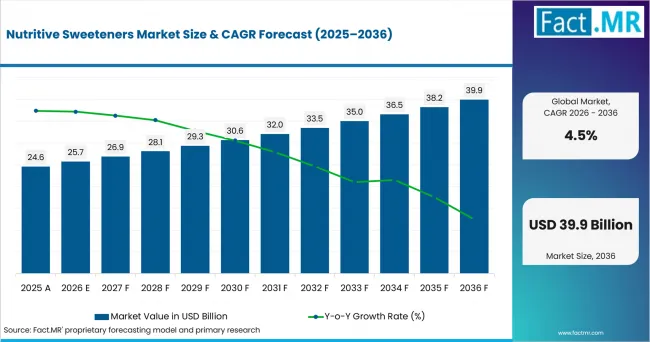
Nutritive Sweeteners Market Value Analysis | Source: Fact.MR
What are the defining numbers behind Nutritive Sweeteners Market growth?
USD 14.2 billion absolute opportunity by 2036, led by Sucrose Sweeteners and Food Manufacturers alongside Direct Industrial Sales.
- Demand Drivers in the Market
- Food manufacturers need sweeteners that deliver sweetness and body without recipe redesign.
- Beverage processors use syrups when dosing lines already support wet handling.
- Bakery and confectionery companies rely on sucrose for browning.
- Ingredient processors need process controls for consistent syrup quality.
- Key Segments Analyzed
- By Product: Sucrose Sweeteners are expected to hold 68.40% share in 2026 due to their role in processed foods and bakery recipes.
- By Application: Bakery & Confectionery is projected to account for 37.80% share in 2026 where browning and crystal behavior shape products.
- By End Use: Food Manufacturers are anticipated to capture 74.10% share in 2026 since large accounts buy through contracts and specifications.
- By Technology: Crystallization Technology is estimated to represent 52.60% share in 2026 because refined sugar quality depends on crystal size and color.
- By Formulation: Liquid Sweetener Systems are forecast to hold 45.30% share in 2026 owing to pumpable formats in beverages and wet mixes.
- By Distribution Channel: Direct Industrial Sales are expected to account for 63.70% share in 2026, supported by users that need supply control.
- Analyst Opinion at Fact.MR
- Shambhu Nath Jha, Principal Consultant at Fact.MR, states, “Nutritive sweetener sourcing is not only about sweetness. Industrial accounts buy predictable behavior in dough, syrup and packaged foods. Suppliers are expected to retain repeat contracts when they combine crop access, refinery discipline, documented specifications and stable delivery.”
- Strategic Implications
- Food manufacturers should map sweetener choice to texture and color needs.
- Beverage processors should test syrup viscosity by season.
- Ingredient distributors should hold backup qualified grades.
- Sweetener producers should document color, crystal size and batch consistency.
Germany is projected to post 5.2% CAGR through 2036 on industrial food processing and EU beet-sugar supply. Brazil is expected to record 4.7% CAGR through cane allocation. The USA is anticipated to advance at 4.3% CAGR due to food manufacturing scale. The UK is estimated to register 3.8% CAGR while beverage levy rules affect formulas. Japan is forecast to hold 3.4% CAGR through mature sugar and isoglucose use.
How does the Nutritive Sweeteners Market break down by segment?
Sucrose Sweeteners lead Product at 68.40%; Food Manufacturers lead End Use at 74.10%.
Which product dominates?
Sucrose Sweeteners hold 68.40% share in 2026.
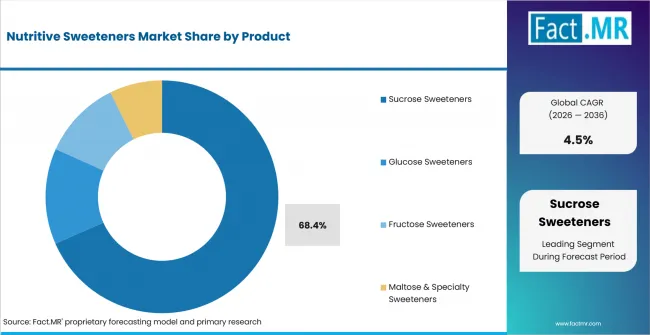
Nutritive Sweeteners Market Analysis By Product | Source: Fact.MR
Sucrose Sweeteners are expected to hold 68.40% share in 2026 because refined cane and beet sugar remain standard bulk inputs. Cane sugar gives processors familiar taste and color. Beet sugar supports European supply. Glucose syrups and dextrose serve wet handling needs.
What leads the Application segment?
Bakery & Confectionery holds 37.80% share in 2026.
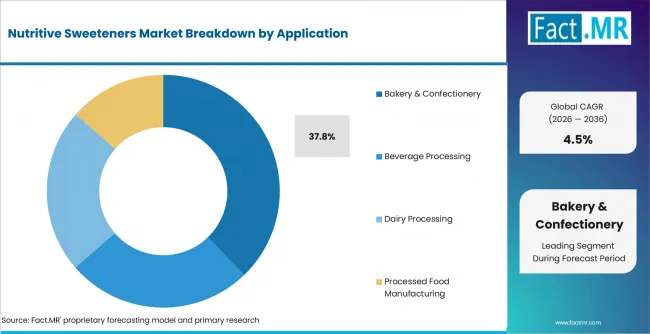
Nutritive Sweeteners Market Analysis By Application | Source: Fact.MR
Bakery & Confectionery is projected to hold 37.80% share in 2026 due to sugar’s role in browning and crystal control. Baked goods rely on sucrose for color. Confectionery products need predictable sweetness. Beverage and dairy uses remain tied to installed syrup systems.
How does End Use shape demand?
Food Manufacturers hold 74.10% share in 2026.
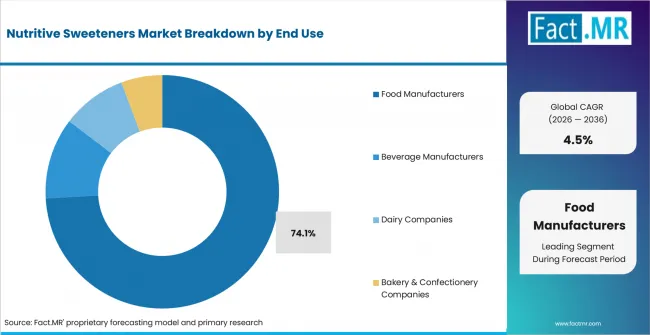
Nutritive Sweeteners Market Analysis By End Use | Source: Fact.MR
Food Manufacturers are projected to lead with 74.10% share in 2026 as packaged food producers require sweeteners for large-scale production. Consistent demand across bakery, confectionery, beverages and processed foods supports bulk purchasing and strengthens this segment’s market position.
What supports Crystallization Technology?
Crystallization Technology holds 52.60% share in 2026.
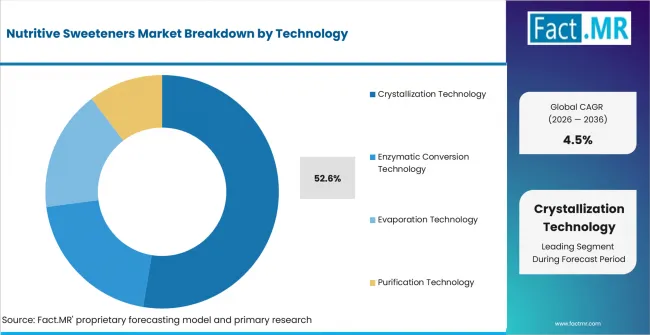
Nutritive Sweeteners Market Analysis By Technology | Source: Fact.MR
Crystallization Technology is estimated to represent 52.60% share in 2026 because refined sugar acceptance depends on crystal uniformity, color and purity. Batch systems support controlled runs. Continuous systems suit higher throughput. Enzymatic conversion and purification remain relevant where clarity decides syrup acceptance.
What leads the Formulation segment?
Liquid Sweetener Systems hold 45.30% share in 2026.
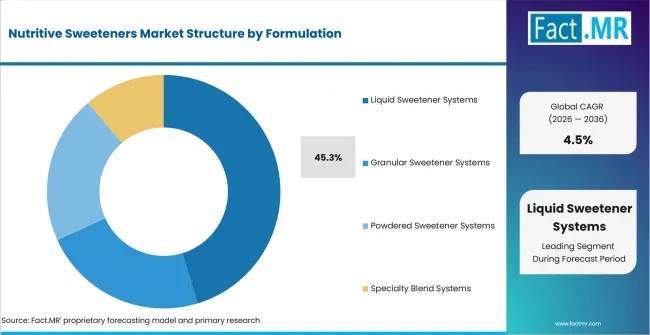
Nutritive Sweeteners Market Analysis By Formulation | Source: Fact.MR
Liquid Sweetener Systems are forecast to hold 45.30% share in 2026 because syrup formulations fit beverage lines and wet-mix operations. Syrup systems reduce dust and manual handling. Blended liquids help processors tune sweetness and viscosity. Dry formats remain relevant where powder handling is required.
How does Distribution Channel shape supply?
Direct Industrial Sales hold 63.70% share in 2026.
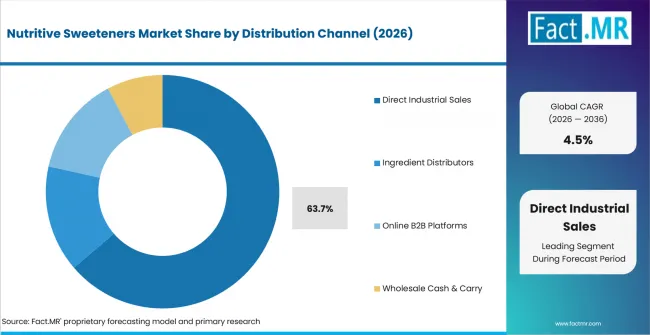
Nutritive Sweeteners Market Analysis By Distribution Channel | Source: Fact.MR
Direct Industrial Sales are expected to account for 63.70% share in 2026 because large accounts need specifications, timing and price terms in one agreement. Manufacturer agreements reduce switching risk. Enterprise teams align volume with inventory plans. Distributors serve smaller regional lots.
What is accelerating Nutritive Sweeteners Market adoption, and what is holding it back?
Industrial food processing drives it; sugar-label pressure restrains it.
Drivers Impact Analysis
| DRIVER | (~) % IMPACT ON CAGR | GEOGRAPHIC RELEVANCE | IMPACT TIMELINE |
|---|---|---|---|
| Bakery and confectionery use | +1.1% | Global food manufacturing hubs | Short term (<= 2 years) |
| Direct industrial procurement | +0.9% | USA, Germany, UK | Short term (<= 2 years) |
| Liquid syrup processing | +0.8% | USA, Japan, Brazil | Medium term (2-4 years) |
| Crystallization quality control | +0.7% | Germany, Brazil, Japan | Medium term (2-4 years) |
| Cane and beet supply allocation | +0.5% | Brazil and Europe | Medium term (2-4 years) |
Source: Fact.MR analysis. Updated Aug 11, 2026
- Bakery and confectionery use: Sucrose provides sweetness, browning and texture in formulas that need plant trials before replacement.
- Direct industrial procurement: Large users are expected to favor agreements that fix grades, delivery windows and price terms before production runs.
- Liquid syrup processing: Beverage and dairy plants are projected to keep syrup formats. USDA ERS reported in July 2026 that U.S. 2026/27 sugar deliveries for human consumption were forecast at 12.441 million short tons, raw value.
- Crystallization quality control: Refined sugar users need predictable color and grain size before approving repeat suppliers.
Opportunity Impact Analysis
| OPPORTUNITY | (~) % IMPACT ON CAGR | GEOGRAPHIC RELEVANCE | IMPACT TIMELINE |
|---|---|---|---|
| Application-specific liquid systems | +0.5% | Beverage and dairy processors | Medium term (2-4 years) |
| Syrup blend optimization | +0.4% | USA and Japan | Medium term (2-4 years) |
| Industrial supply agreements | +0.3% | Germany and UK | Short term (<= 2 years) |
| Regional B2B distribution | +0.2% | Brazil and regional distributors | Long term (>= 4 years) |
Source: Fact.MR analysis. Updated Aug 11, 2026
- Application-specific liquid systems: Sweetener producers are expected to add value through liquid blends built for viscosity and solids control.
- Syrup blend optimization: Formulators adjust glucose, fructose and sucrose systems to manage taste, body and cost.
- Industrial supply agreements: Direct contracts are anticipated to gain weight as food manufacturers seek traceable grades and dependable delivery.
- Regional B2B distribution: Distributors serve smaller processors that need repeat grades without full industrial contract volumes.
Restraints Impact Analysis
| RESTRAINT | (~) % IMPACT ON CAGR | GEOGRAPHIC RELEVANCE | IMPACT TIMELINE |
|---|---|---|---|
| Added-sugar label scrutiny | -0.5% | USA, UK, Japan | Short term (<= 2 years) |
| Crop and yield variability | -0.4% | Brazil, UK, Germany | Short term (<= 2 years) |
| HFCS and fructose perception | -0.3% | USA and Japan | Medium term (2-4 years) |
| Sugar price cycles | -0.2% | Brazil and Europe | Long term (>= 4 years) |
Source: Fact.MR analysis. Updated Aug 11, 2026
- Added-sugar label scrutiny: Packaged food and beverage brands face closer review when sugar appears clearly on labels.
- Crop and yield variability: Cane and beet output can move with weather and planted area. That variation affects refinery schedules.
- HFCS and fructose perception: Some brands are expected to reduce high-fructose exposure where shorter labels influence choice.
- Sugar price cycles: Lower price cycles can weaken processor margins and delay some contract renewals.
Which countries are scaling Nutritive Sweeteners Market fastest?
- The country comparison spans 1.8 percentage points.
- Germany remains 0.5 percentage point above Brazil.
- Brazil remains 0.4 percentage point above the USA.
- The USA remains 0.5 percentage point above the UK.
- The UK remains 0.4 percentage point above Japan.
- Japan closes the displayed range through a mature refined sugar and isoglucose base.
Comparable CAGRs create different entry conditions because each country links nutritive sweeteners to a different manufacturing base. Full coverage includes North America, Latin America, Europe, East Asia, South Asia and Pacific, Middle East and Africa.
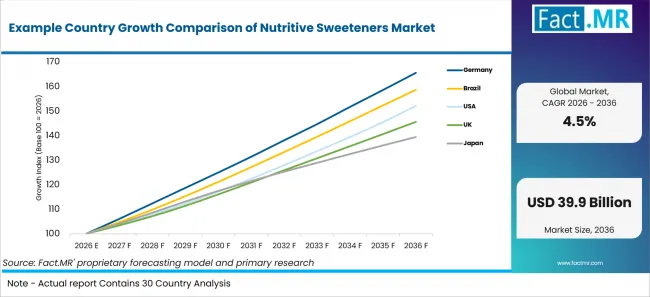
Example Country Growth Comparison Of Nutritive Sweeteners Market | Source: Fact.MR
| COUNTRY | CAGR |
|---|---|
| Germany | 5.2% |
| Brazil | 4.7% |
| USA | 4.3% |
| UK | 3.8% |
| Japan | 3.4% |
Source: Fact.MR analysis. Updated Aug 11, 2026
What supports Germany adoption?
5.2% CAGR, supported by industrial food processing and EU sugar availability.
Germany’s growth reflects processors that buy against tight specifications. Destatis reported in January 2026 that wholesale prices for sugar, confectionery and bakery products were 12.8% higher in December 2025 than a year earlier.
How is Brazil scaling demand?
4.7% CAGR, shaped by cane allocation and refined sugar output.
Brazil’s growth reflects its large sugarcane processing base and established refining capabilities. Demand from beverage, bakery and packaged food manufacturers supports market expansion, while weather conditions, cane allocation and export price movements can influence food-grade sugar availability and supply terms.
What supports USA adoption?
4.3% CAGR, supported by food manufacturing scale and corn sweetener infrastructure.
USA demand is linked to packaged food and beverage manufacturing. Corn syrup and dextrose remain relevant where wet handling equipment is installed. Large manufacturers use direct contracts to control grade changes.
How is the UK developing demand?
3.8% CAGR, influenced by beet supply and beverage levy rules.
UK demand is shaped by beet output and refined sugar imports. HM Treasury and HMRC stated in July 2026 that the Soft Drinks Industry Levy threshold is scheduled to fall from 5 grams to 4.5 grams per 100 millilitres from January 2028.
How does Japan perform?
3.4% CAGR, led by mature sugar and isoglucose use.
Japan’s growth reflects stable demand from beverage and packaged food producers that require consistent sweetness and clearly documented ingredient grades. Mature formulations support refined sugar use, while lower-sweetness preferences, procurement rules and established recipes may limit faster supplier switching and volume expansion.
Who leads the Nutritive Sweeteners Market?
Cargill Inc., Archer Daniels Midland Company and Tereos SA show the clearest direct relevance, while COFCO International and Wilmar International Limited strengthen sugar supply coverage.
Cargill Inc. and Archer Daniels Midland Company are directly relevant because their portfolios include sucrose, corn syrup, glucose syrup, dextrose and fructose systems. Tereos SA adds beet, cane and starch-based sweetener coverage. COFCO International and Wilmar International Limited add sugar operations. Tate & Lyle, Showa Sangyo Co. Ltd., Bannari Amman Sugars Limited and Bajaj Hindusthan Sugar Limited remain relevant through sugar, syrup, starch or food-ingredient supply. In May 2026, ADM announced a multimillion-dollar upgrade at its Clinton, Iowa corn-processing facility, which includes a corn wet mill producing corn sweeteners and starches; the project adds two receiving pits rated at 25,000 bushels per hour each.
Which companies are the key providers?
Key companies include Cargill Inc., Tate & Lyle, Showa Sangyo Co. Ltd., COFCO International, Archer Daniels Midland Company, Bannari Amman Sugars Limited, Bajaj Hindusthan Sugar Limited, Tereos SA, and Wilmar International Limited.
- Cargill Inc.
- Tate & Lyle
- Showa Sangyo Co. Ltd.
- COFCO International
- Archer Daniels Midland Company
- Bannari Amman Sugars Limited
- Bajaj Hindusthan Sugar Limited
- Tereos SA
- Wilmar International Limited
Bibliography
- ADM. (2026, February 3). ADM reports fourth quarter and full-year 2025 results; provides 2026 guidance.
- Abadam, V., & Huang, J. (2026, July 16). Sugar and Sweeteners Outlook: July 2026 (SSS-M-455). U.S. Department of Agriculture, Economic Research Service.
- U.S. Bureau of Labor Statistics. (2026, June 29). Sectoral output for manufacturing: Sugar and confectionery product manufacturing (NAICS 3113) in the United States [Data set]. Federal Reserve Bank of St. Louis.
- Statistisches Bundesamt (Destatis). (2026, January 15). Wholesale prices in December 2025: +1.2% on December 2024.
- Department for Environment, Food & Rural Affairs. (2026, July 29). Agriculture in the United Kingdom 2025: Chapter 7—Crops.
- U.S. Department of Agriculture, Foreign Agricultural Service. (2025, April 21). China: Sugar annual. The GAIN report identifies April 21, 2025 as the public distribution date.
This Report Answers
- The report covers Product and Application choices that shape food and beverage formulation.
- Segment analysis covers Sucrose Sweeteners and Bakery & Confectionery as 2026 share leaders.
- Country outlook evaluates Germany, Brazil, the USA, the UK and Japan.
- Competitive analysis profiles Cargill Inc., Archer Daniels Midland Company, Tereos SA and COFCO International. Regional sugar and starch producers complete the provider set.
- Process assessment covers Crystallization Technology and Liquid Sweetener Systems. Direct Industrial Sales completes the channel view.
What does the Nutritive Sweeteners Market cover?
Nutritive sweeteners are caloric carbohydrate ingredients that add sweetness, solids and process behavior to food and beverages.
The Nutritive Sweeteners Market covers sucrose, glucose, fructose and specialty syrup systems used in industrial recipes.
Coverage includes baked goods, confectionery products, beverage processing, dairy processing and packaged foods. Industrial buyer behavior overlaps with industrial sugar where refined sugar is supplied in bulk to processors.
What is included in the scope?
The scope includes Product, Application, End Use, Technology, Formulation and Distribution Channel. Bakery use is linked to baking ingredients where sugar supports browning, moisture and dough behavior.
Confectionery applications are included only when sweeteners are sold as inputs. Finished confectionery products remain outside this report except where they explain ingredient pull from manufacturers.
What is excluded from the scope?
Non-caloric and high-intensity sweeteners remain outside the core scope unless they explain competitive reformulation pressure.
The scope excludes artificial sweeteners, sugar alcohols and sweetness modulators that do not provide caloric bulk. Finished foods in food processing ingredients are excluded unless the sweetener itself is sold as an input.
How Was the Analysis Built?
The analysis draws on 120+ sources, 35+ company portfolios, 25+ countries and more than 20 industry interviews.
- Primary Research: Primary research includes discussions with manufacturers, ingredient suppliers, distributors, procurement teams and food technologists. These conversations examine grade selection, formulation behavior, supply agreements and quality documentation.
- Desk Research: Desk research covers government statistics, company portfolios, regulatory publications, official agriculture data, sugar supply reports and label rules. Every source used in the analysis is documented in the bibliography.
- Market Sizing and Forecasting: Market estimates combine historical performance, demand indicators, product shares, country-level growth, food manufacturing activity, sweetener supply patterns and company participation.
- Data Validation and Update Cycle: Findings are validated by comparing primary interviews with public data, company activity, regulatory changes and crop estimates. Regular updates review launches, capacity changes, label rules and buyer behavior.
Segmentation
What is the report’s scope and coverage?
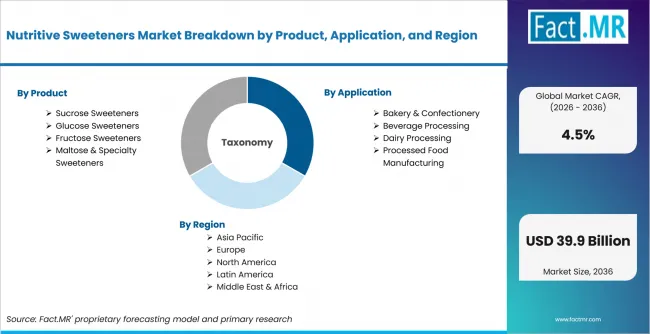
Nutritive Sweeteners Market Breakdown By Product, Application, And Region | Source: Fact.MR
| ATTRIBUTE | DETAILS |
|---|---|
| Quantitative Units | USD billion |
| Market Definition | Caloric carbohydrate sweeteners that add sweetness, solids, body and process behavior to foods and beverages |
| Product | Sucrose Sweeteners; Glucose Sweeteners; Fructose Sweeteners; Maltose & Specialty Sweeteners |
| Application | Bakery & Confectionery; Beverage Processing; Dairy Processing; Processed Food Manufacturing |
| End Use | Food Manufacturers; Beverage Manufacturers; Dairy Companies; Bakery & Confectionery Companies |
| Technology | Crystallization Technology; Enzymatic Conversion Technology; Evaporation Technology; Purification Technology |
| Formulation | Liquid Sweetener Systems; Granular Sweetener Systems; Powdered Sweetener Systems; Specialty Blend Systems |
| Distribution Channel | Direct Industrial Sales; Ingredient Distributors; Online B2B Platforms; Wholesale Cash & Carry |
| Regions Covered | North America; Latin America; Europe; East Asia; South Asia and Pacific; Middle East and Africa |
| Countries Covered | Germany; Brazil; USA; UK; Japan |
| Key Companies Profiled | Cargill Inc.; Tate & Lyle; Showa Sangyo Co. Ltd.; COFCO International; Archer Daniels Midland Company; Bannari Amman Sugars Limited; Bajaj Hindusthan Sugar Limited; Tereos SA; Wilmar International Limited |
| Forecast Period | 2026 to 2036 |
| Approach | Hybrid top-down and bottom-up approach using food manufacturing demand, sweetener supply data, crop allocation, formulation needs, country adoption patterns and company portfolio review |
Source: Fact.MR analysis. Updated Aug 11, 2026
How is the market segmented?
-
By Product
- Sucrose Sweeteners
- Refined Cane Sugar
- Refined Beet Sugar
- Glucose Sweeteners
- Glucose Syrups
- Dextrose Products
- Fructose Sweeteners
- Crystalline Fructose
- High Fructose Syrups
- Maltose & Specialty Sweeteners
- Maltose Syrups
- Invert Sugar Products
- Sucrose Sweeteners
-
By Application
- Bakery & Confectionery
- Baked Goods
- Confectionery Products
- Beverage Processing
- Carbonated Beverages
- Non-Carbonated Beverages
- Dairy Processing
- Cultured Dairy Products
- Frozen Dairy Products
- Processed Food Manufacturing
- Breakfast Products
- Convenience Foods
- Bakery & Confectionery
-
By End Use
- Food Manufacturers
- Packaged Food Producers
- Ingredient Processors
- Beverage Manufacturers
- Soft Drink Companies
- Juice Manufacturers
- Dairy Companies
- Cultured Dairy Producers
- Frozen Dessert Producers
- Bakery & Confectionery Companies
- Commercial Bakeries
- Confectionery Producers
- Food Manufacturers
-
By Technology
- Crystallization Technology
- Batch Crystallization Systems
- Continuous Crystallization Systems
- Enzymatic Conversion Technology
- Starch Hydrolysis Systems
- Isomerization Systems
- Evaporation Technology
- Multi Effect Evaporation
- Vacuum Evaporation
- Purification Technology
- Ion Exchange Systems
- Membrane Separation Systems
- Crystallization Technology
-
By Formulation
- Liquid Sweetener Systems
- Syrup Formulations
- Blended Liquid Systems
- Granular Sweetener Systems
- Fine Crystal Formulations
- Coarse Crystal Formulations
- Powdered Sweetener Systems
- Spray Dried Formulations
- Milled Powder Systems
- Specialty Blend Systems
- Functional Blend Formulations
- Application Specific Blends
- Liquid Sweetener Systems
-
By Distribution Channel
- Direct Industrial Sales
- Manufacturer Supply Agreements
- Enterprise Procurement
- Ingredient Distributors
- National Distributors
- Regional Distributors
- Online B2B Platforms
- Digital Procurement Portals
- Manufacturer Direct Platforms
- Wholesale Cash & Carry
- Bulk Food Wholesalers
- Specialty Wholesale Networks
- Direct Industrial Sales
-
By Region
- North America
- USA
- Latin America
- Brazil
- Europe
- Germany
- UK
- East Asia
- Japan
Frequently Asked Questions
How big is the nutritive sweeteners market in 2026?
The nutritive sweeteners market is valued at USD 25.7 billion in 2026 and is forecast to reach USD 39.9 billion by 2036.
Which product leads the nutritive sweeteners market?
Which application leads the nutritive sweeteners market?
Who are the leading companies in the nutritive sweeteners market?
Who worked on this report


Preview the report firsthand - request a free sample
Free SampleGet the brochure for pricing and purchase details
Download PDF